Copyright
©The Author(s) 2020.
World J Gastroenterol. Oct 28, 2020; 26(40): 6207-6223
Published online Oct 28, 2020. doi: 10.3748/wjg.v26.i40.6207
Published online Oct 28, 2020. doi: 10.3748/wjg.v26.i40.6207
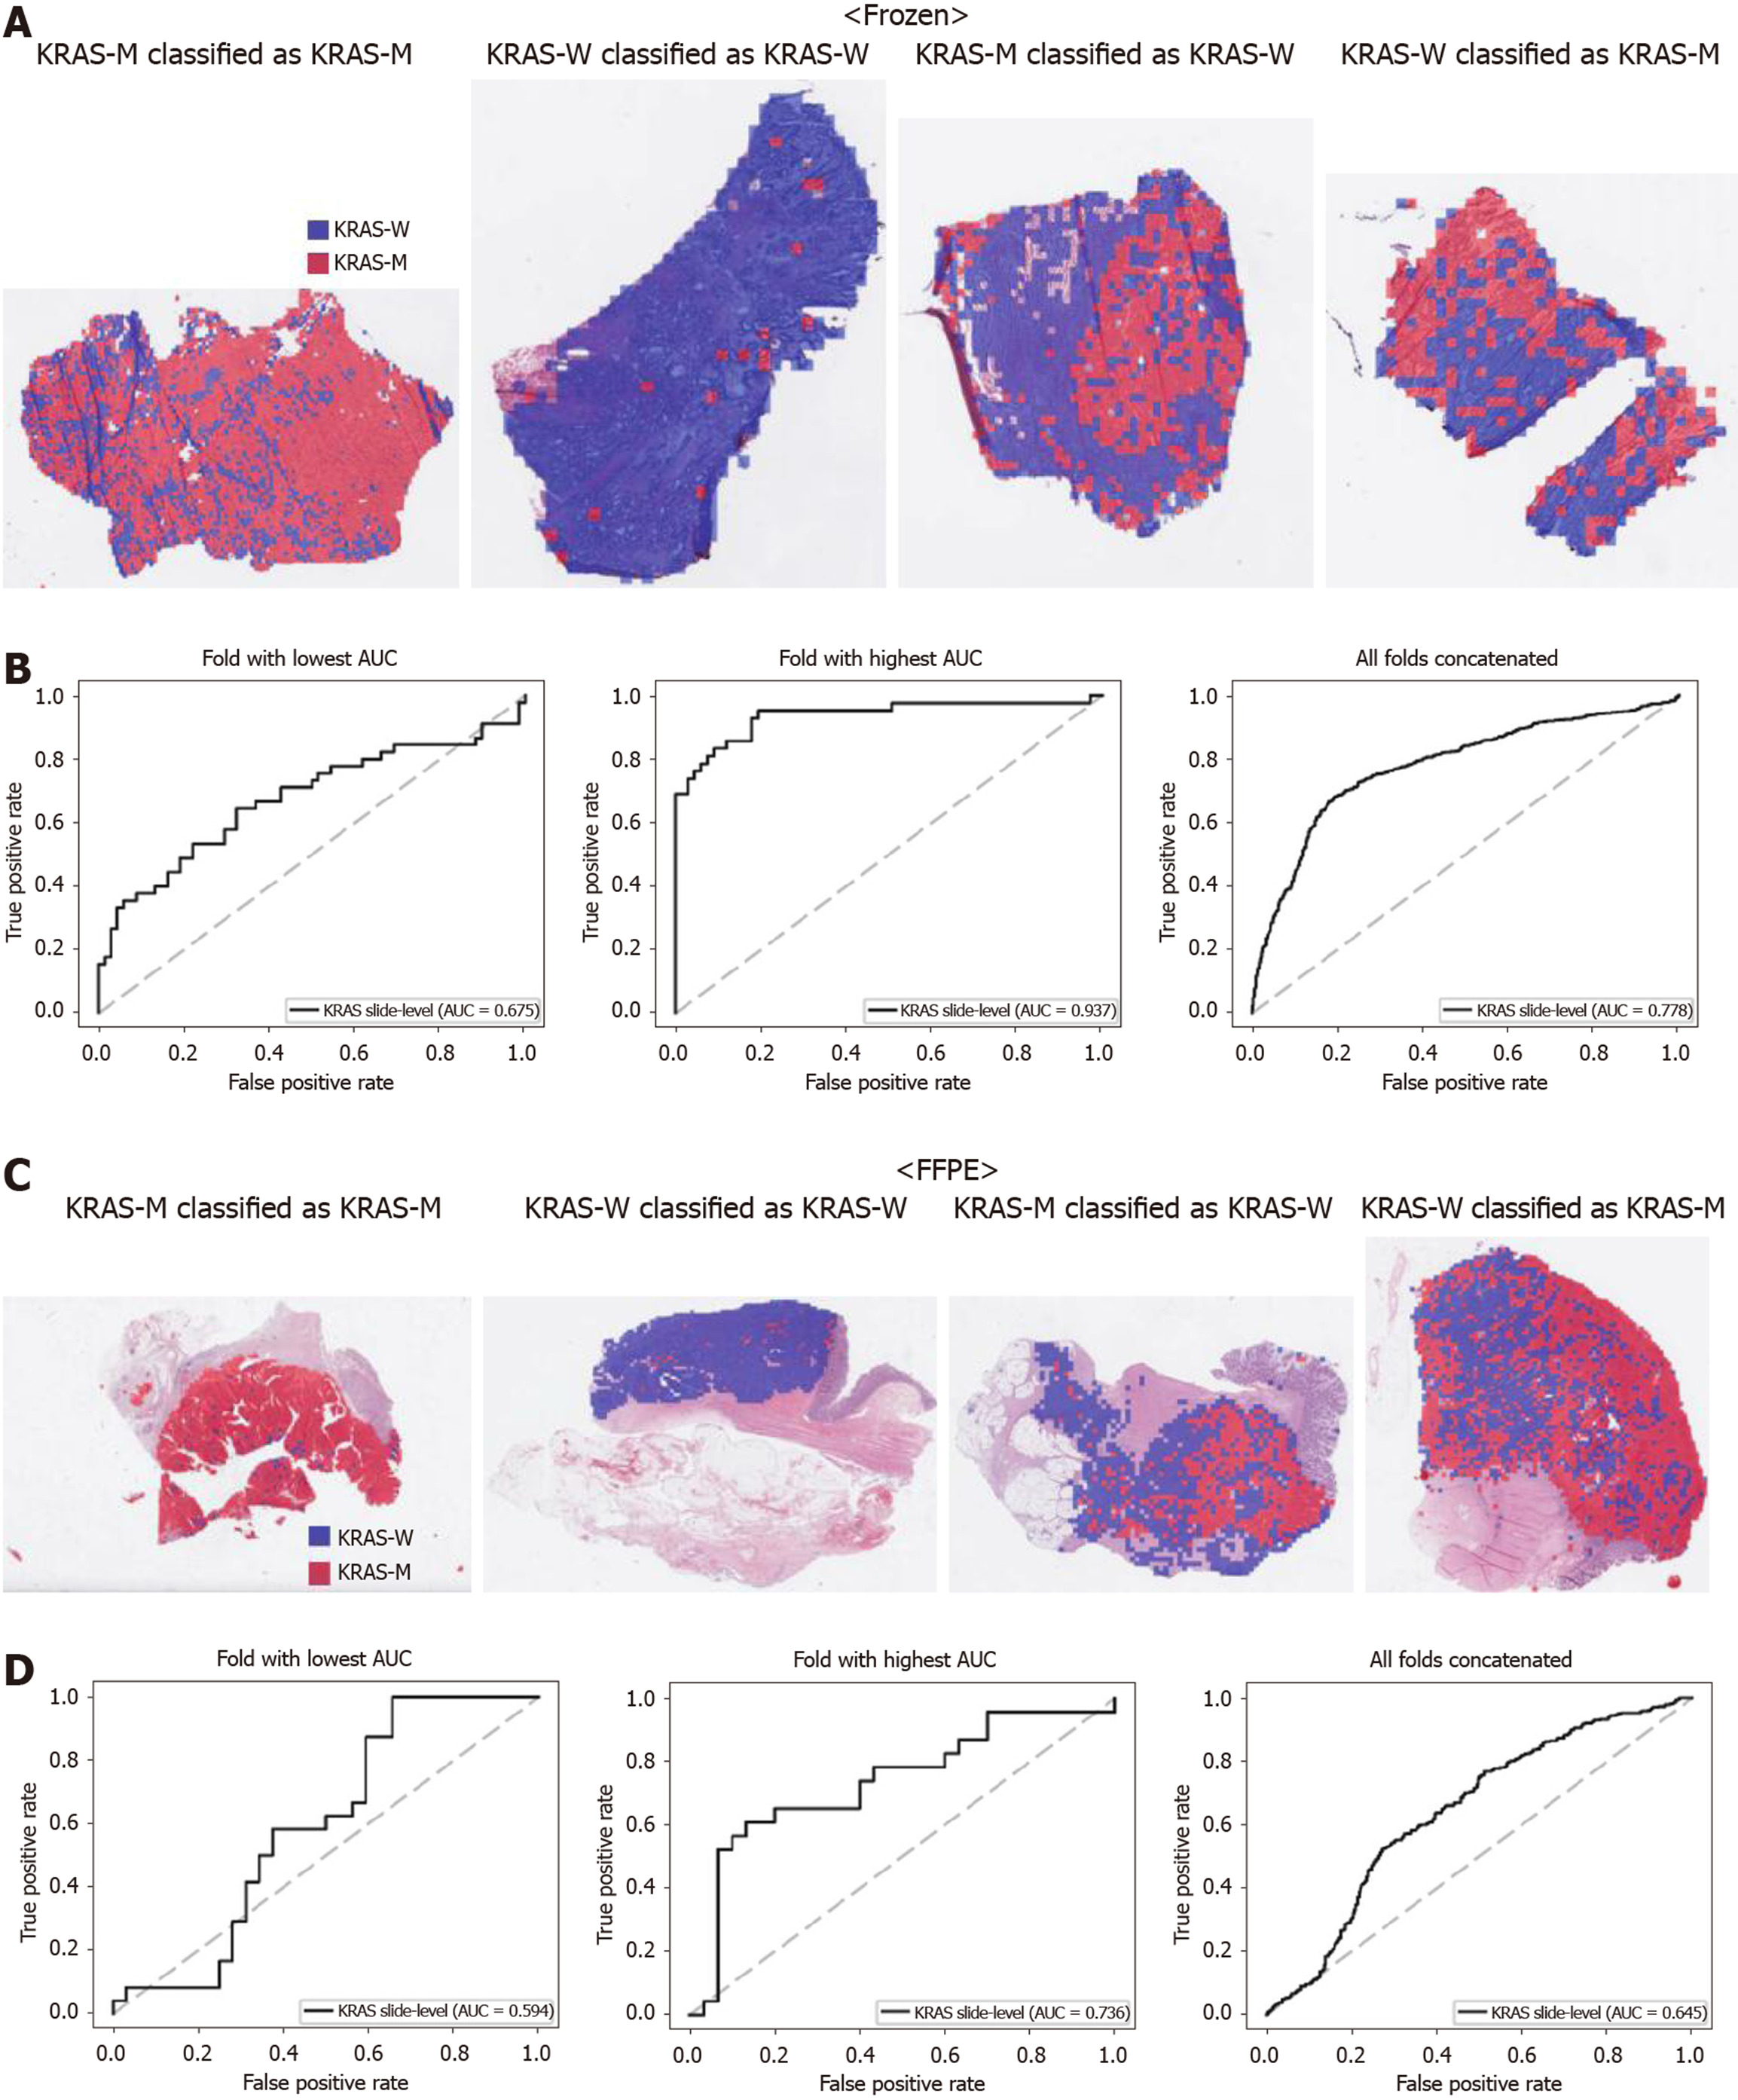
Figure 3 Classifiers to predict KRAS gene mutation for the Cancer Genome Atlas colorectal cancer tissue slides.
A: Representative whole slide images (WSIs) of the frozen slides with KRAS gene mutation correctly classified as mutation, with wild-type gene correctly classified as wild-type, with gene mutation falsely classified as wild-type, and with wild-type gene falsely classified as mutation, from left to right; B: Receiver operating characteristic curves for the fold with lowest area under the curve (AUC), for the fold with highest AUC, and for the concatenated results of all ten folds, from left to right, obtained with the classifiers trained with the frozen tissues; C and D: Same as A and B, but the results were for the formalin-fixed paraffin-embedded WSIs. KRAS-M: KRAS mutated; KRAS-W: KRAS wild-type; AUC: Area under the curve; FFPE: Formalin-fixed paraffin-embedded.
- Citation: Jang HJ, Lee A, Kang J, Song IH, Lee SH. Prediction of clinically actionable genetic alterations from colorectal cancer histopathology images using deep learning. World J Gastroenterol 2020; 26(40): 6207-6223
- URL: https://www.wjgnet.com/1007-9327/full/v26/i40/6207.htm
- DOI: https://dx.doi.org/10.3748/wjg.v26.i40.6207


