Copyright
©The Author(s) 2020.
World J Gastroenterol. Sep 28, 2020; 26(36): 5420-5436
Published online Sep 28, 2020. doi: 10.3748/wjg.v26.i36.5420
Published online Sep 28, 2020. doi: 10.3748/wjg.v26.i36.5420
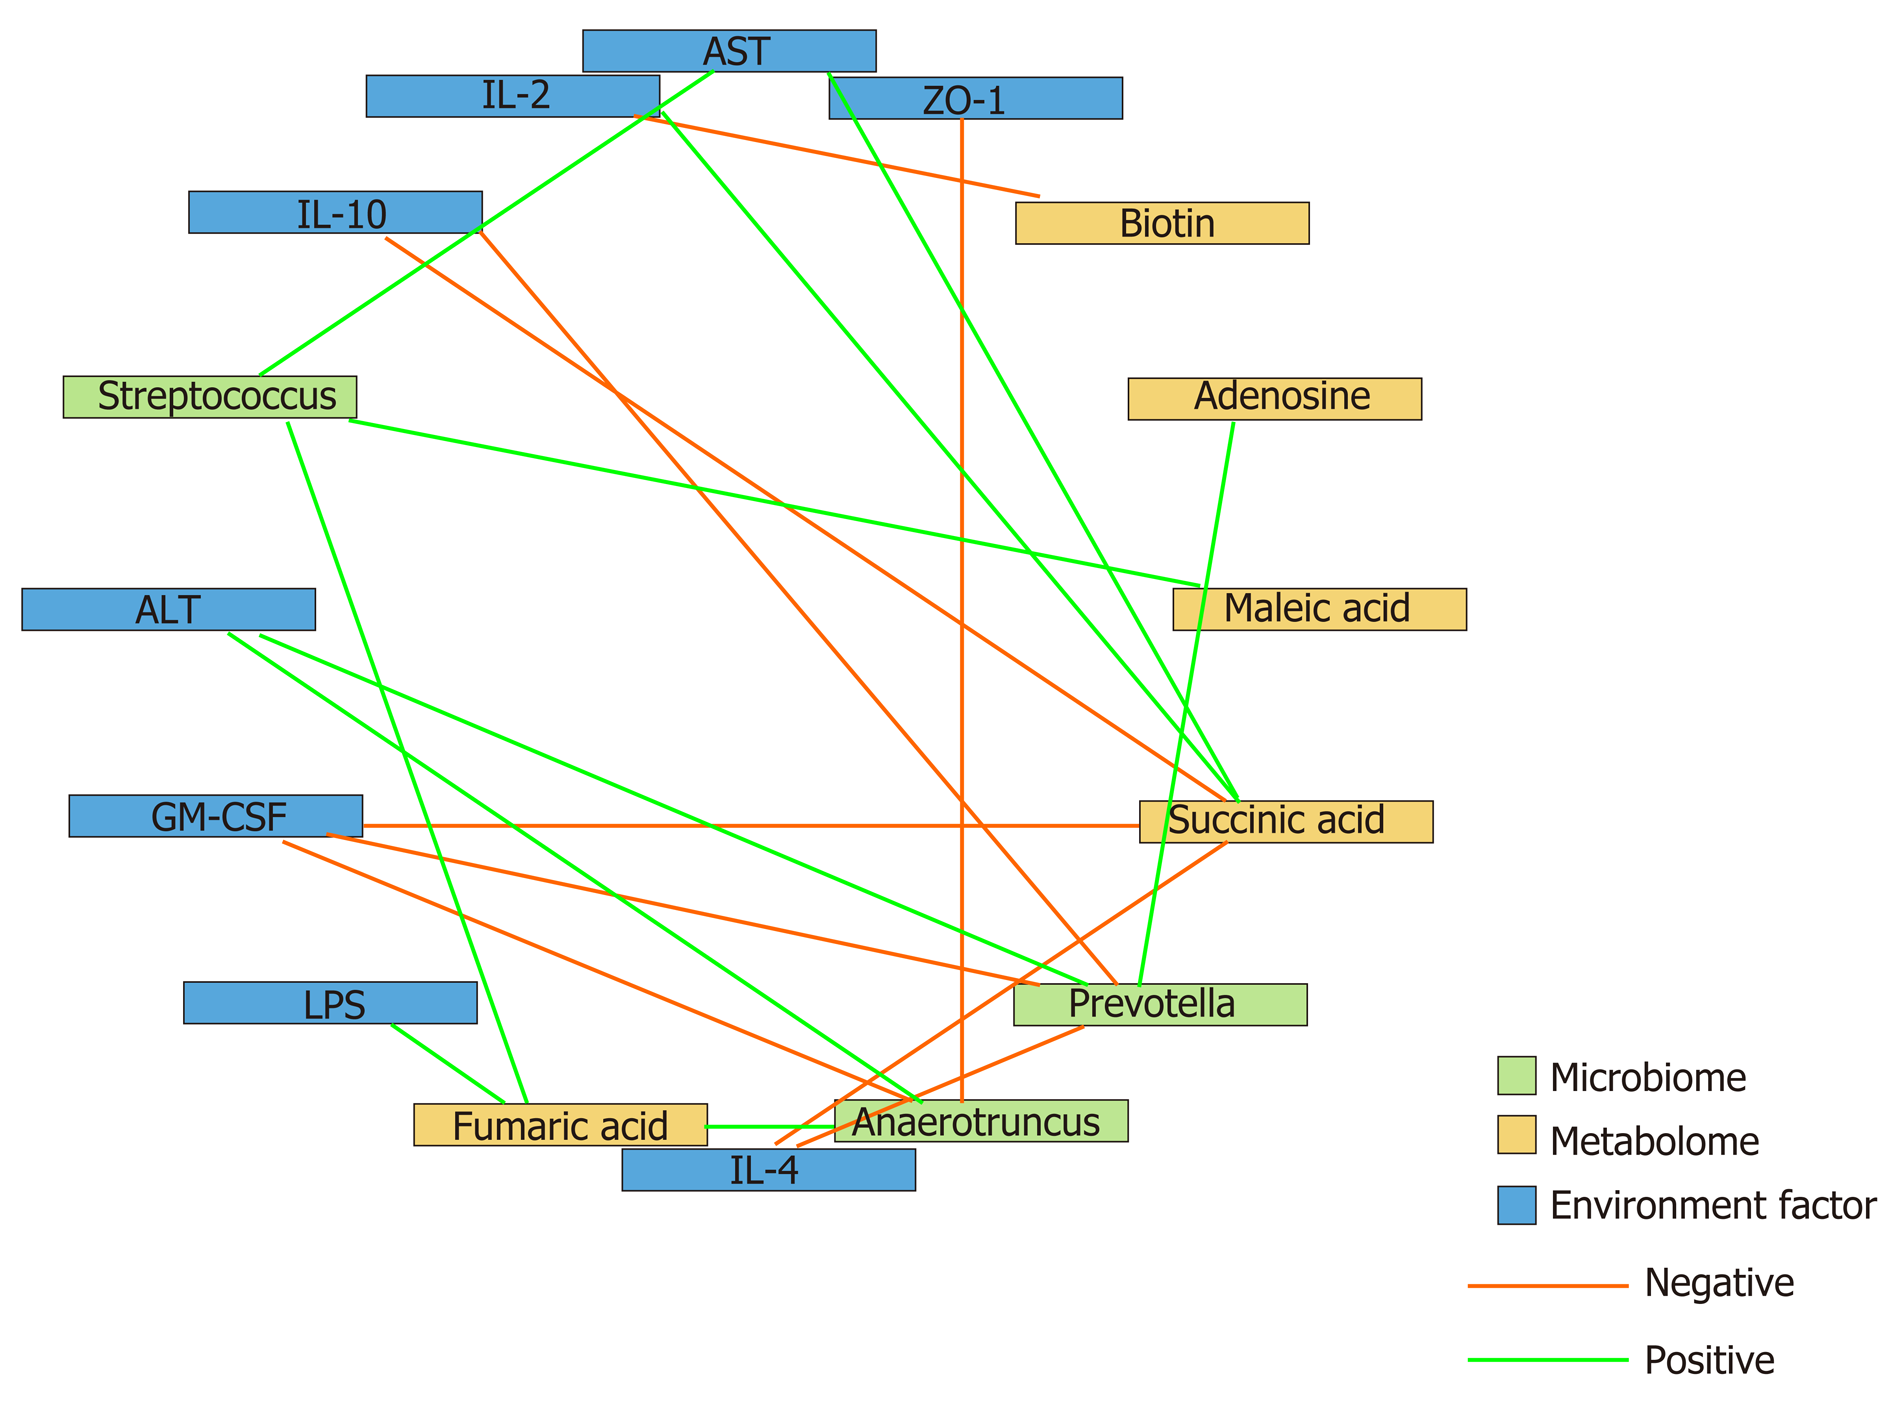
Figure 6 Correlation analysis of the representative microbial genera, characterized metabolites, and environmental factors (parameters indicating liver and gut impairment) among the control, hepatocellular carcinoma, and hepatocellular carcinoma + granulocyte-macrophage colony-stimulating factor groups.
Spearman’s rank correlation was used, and significant associations with P < 0.05 and r > 0.5 were found. Blue nodes, representative injury parameters; green nodes, differentially distributed genera; yellow nodes, metabolites with a high discriminative power between the groups. Green lines between nodes indicate positive linkages, and orange lines represent negative relationships. The thickness of the connection represents the correlation coefficient, with thicker lines indicating higher r values. ALT: Alanine aminotransferase; AST: Aspartate aminotransferase; LPS: Lipopolysaccharide; IL-2: Interleukin-2; GM-CSF: Granulocyte-macrophage colony-stimulating factor.
- Citation: Wu YN, Zhang L, Chen T, Li X, He LH, Liu GX. Granulocyte-macrophage colony-stimulating factor protects mice against hepatocellular carcinoma by ameliorating intestinal dysbiosis and attenuating inflammation. World J Gastroenterol 2020; 26(36): 5420-5436
- URL: https://www.wjgnet.com/1007-9327/full/v26/i36/5420.htm
- DOI: https://dx.doi.org/10.3748/wjg.v26.i36.5420


