Copyright
©The Author(s) 2020.
World J Gastroenterol. Sep 28, 2020; 26(36): 5420-5436
Published online Sep 28, 2020. doi: 10.3748/wjg.v26.i36.5420
Published online Sep 28, 2020. doi: 10.3748/wjg.v26.i36.5420
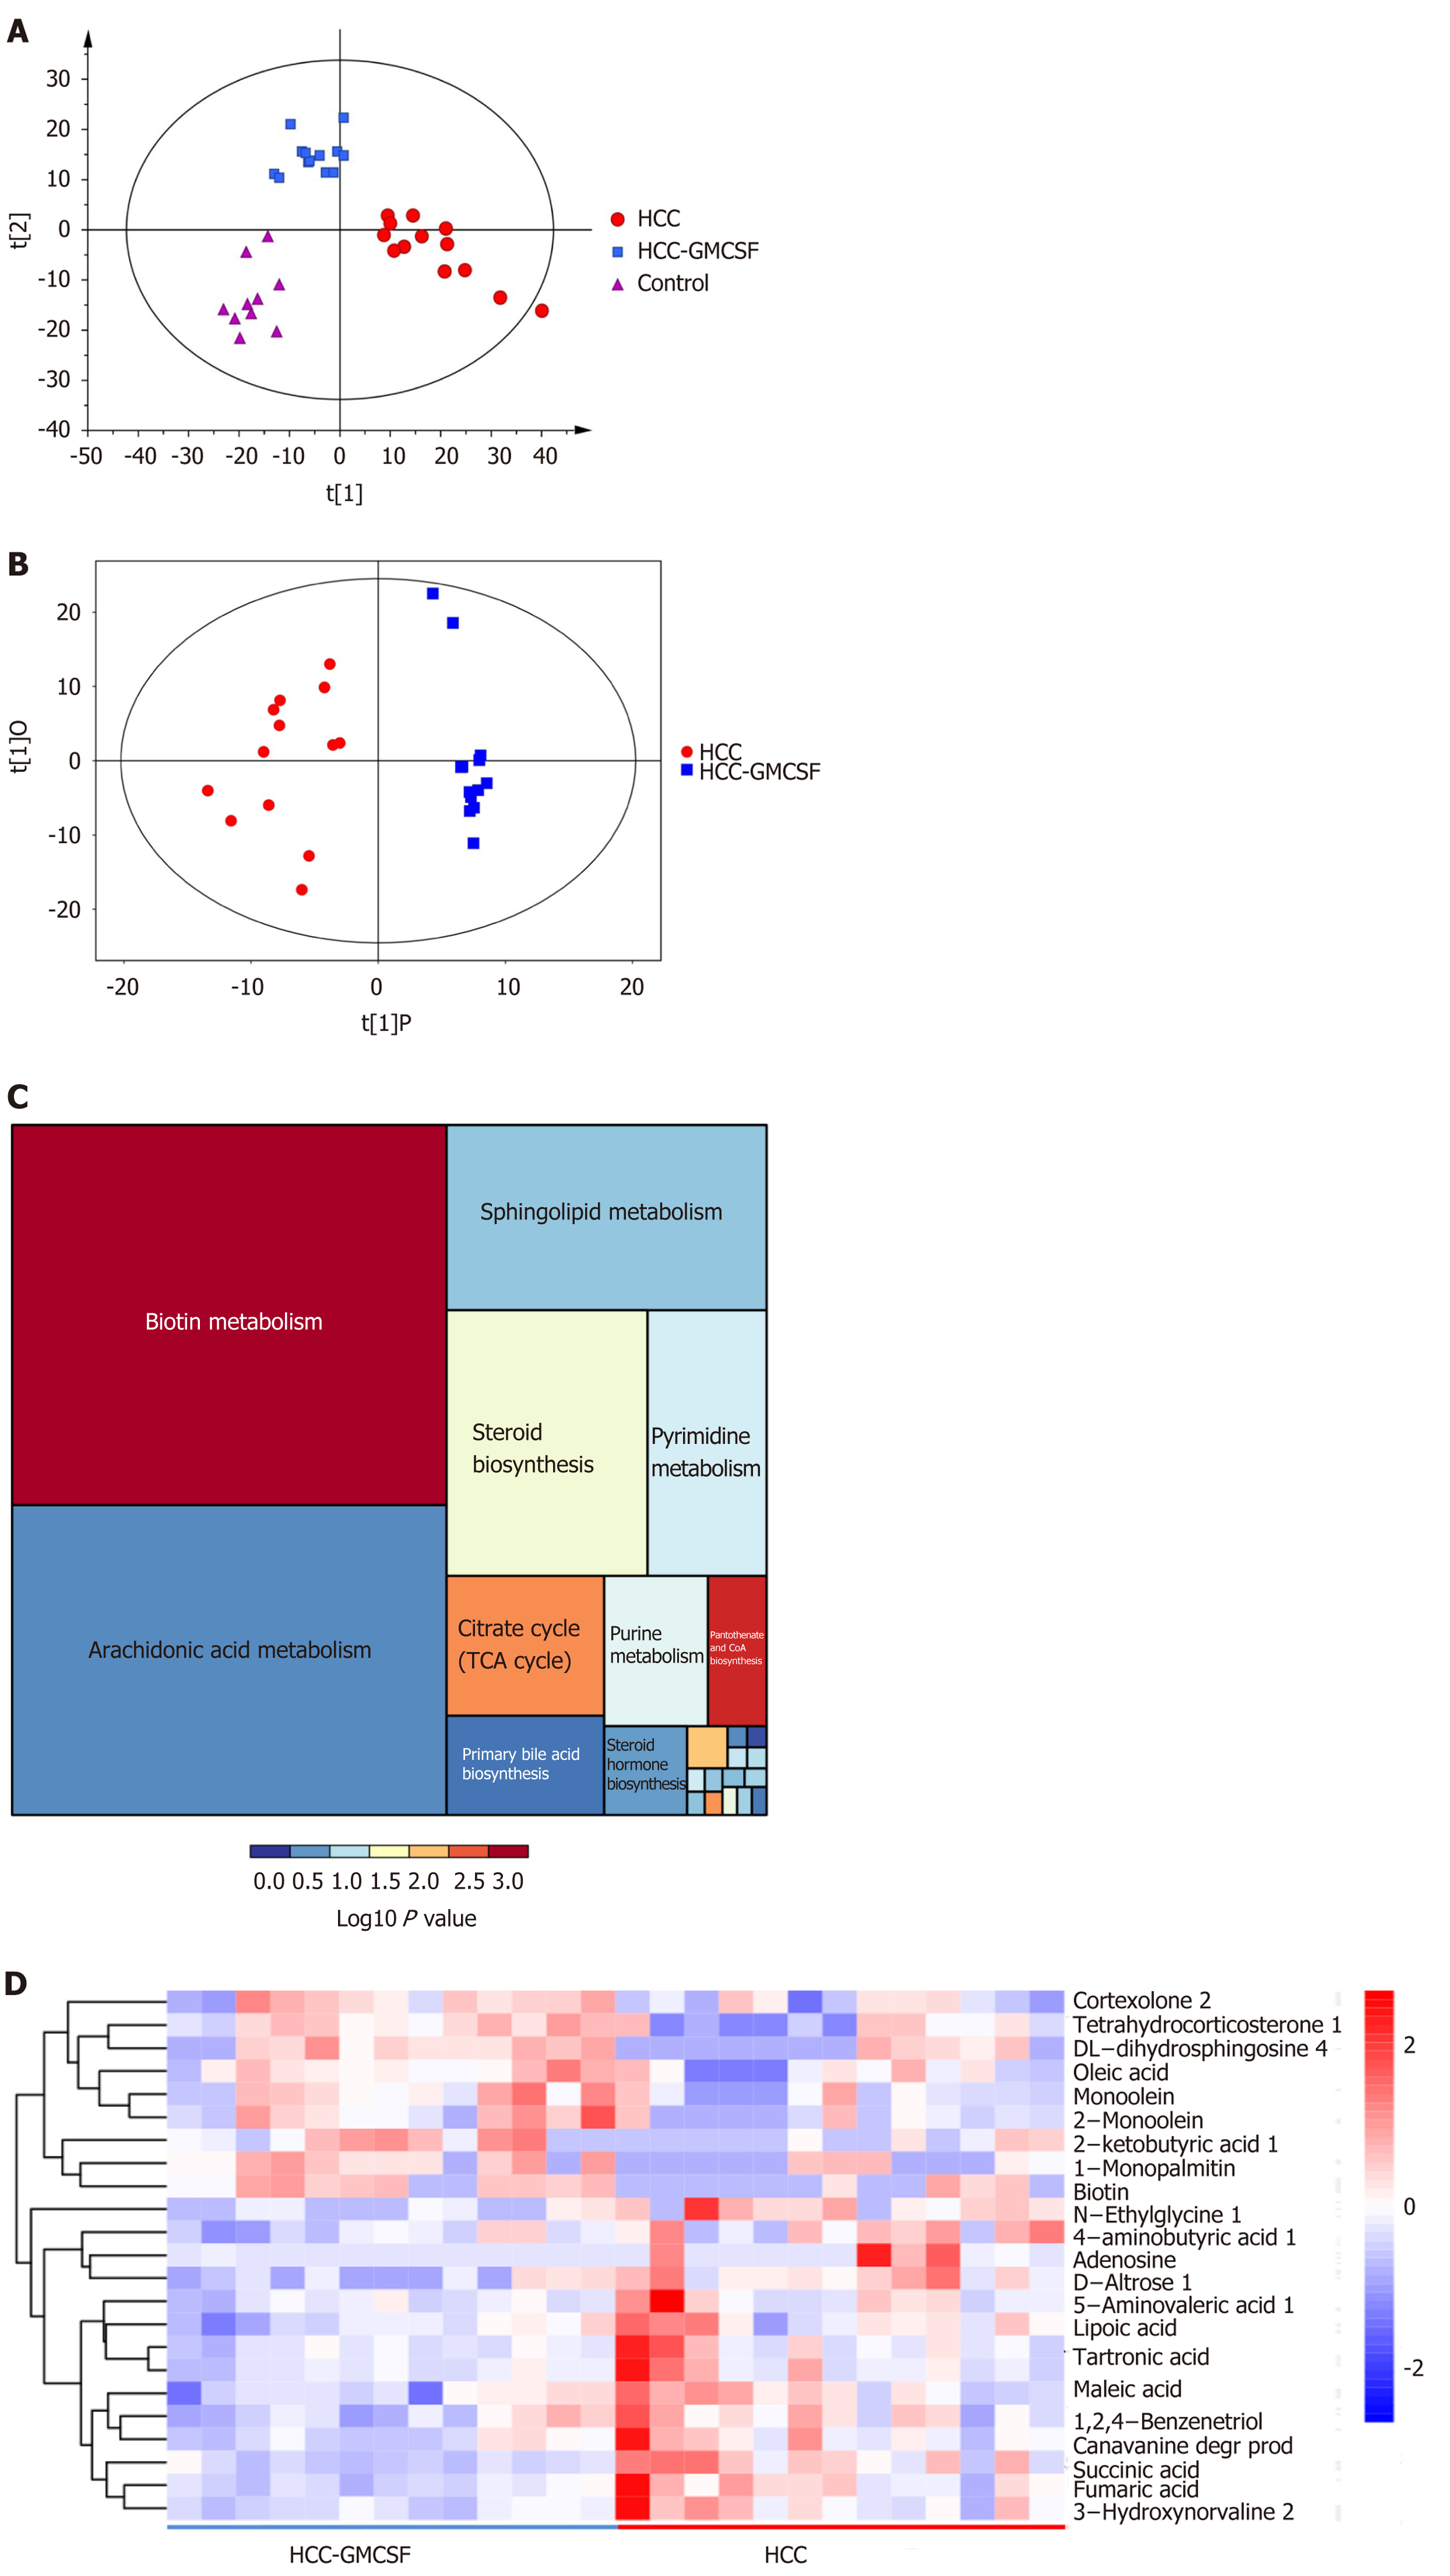
Figure 5 Granulocyte-macrophage colony-stimulating factor normalized the fecal metabolomic profile detected in response to hepatocellular carcinoma.
A: OPLS-DA score scatter plot comparing the control (purple), hepatocellular carcinoma (HCC) (red), and HCC + granulocyte-macrophage colony-stimulating factor (GM-CSF) (blue) groups; B: OPLS-DA score scatter plot comparing the HCC (red) and HCC + GM-CSF (blue) groups; C: Differential involvement of the metabolic pathways between the three groups; D: Heat map detailing the differential detection of metabolites comparing the HCC and HCC + GM-CSF groups. HCC: Hepatocellular carcinoma; GM-CSF: Granulocyte-macrophage colony-stimulating factor.
- Citation: Wu YN, Zhang L, Chen T, Li X, He LH, Liu GX. Granulocyte-macrophage colony-stimulating factor protects mice against hepatocellular carcinoma by ameliorating intestinal dysbiosis and attenuating inflammation. World J Gastroenterol 2020; 26(36): 5420-5436
- URL: https://www.wjgnet.com/1007-9327/full/v26/i36/5420.htm
- DOI: https://dx.doi.org/10.3748/wjg.v26.i36.5420


