Copyright
©The Author(s) 2020.
World J Gastroenterol. Sep 28, 2020; 26(36): 5420-5436
Published online Sep 28, 2020. doi: 10.3748/wjg.v26.i36.5420
Published online Sep 28, 2020. doi: 10.3748/wjg.v26.i36.5420
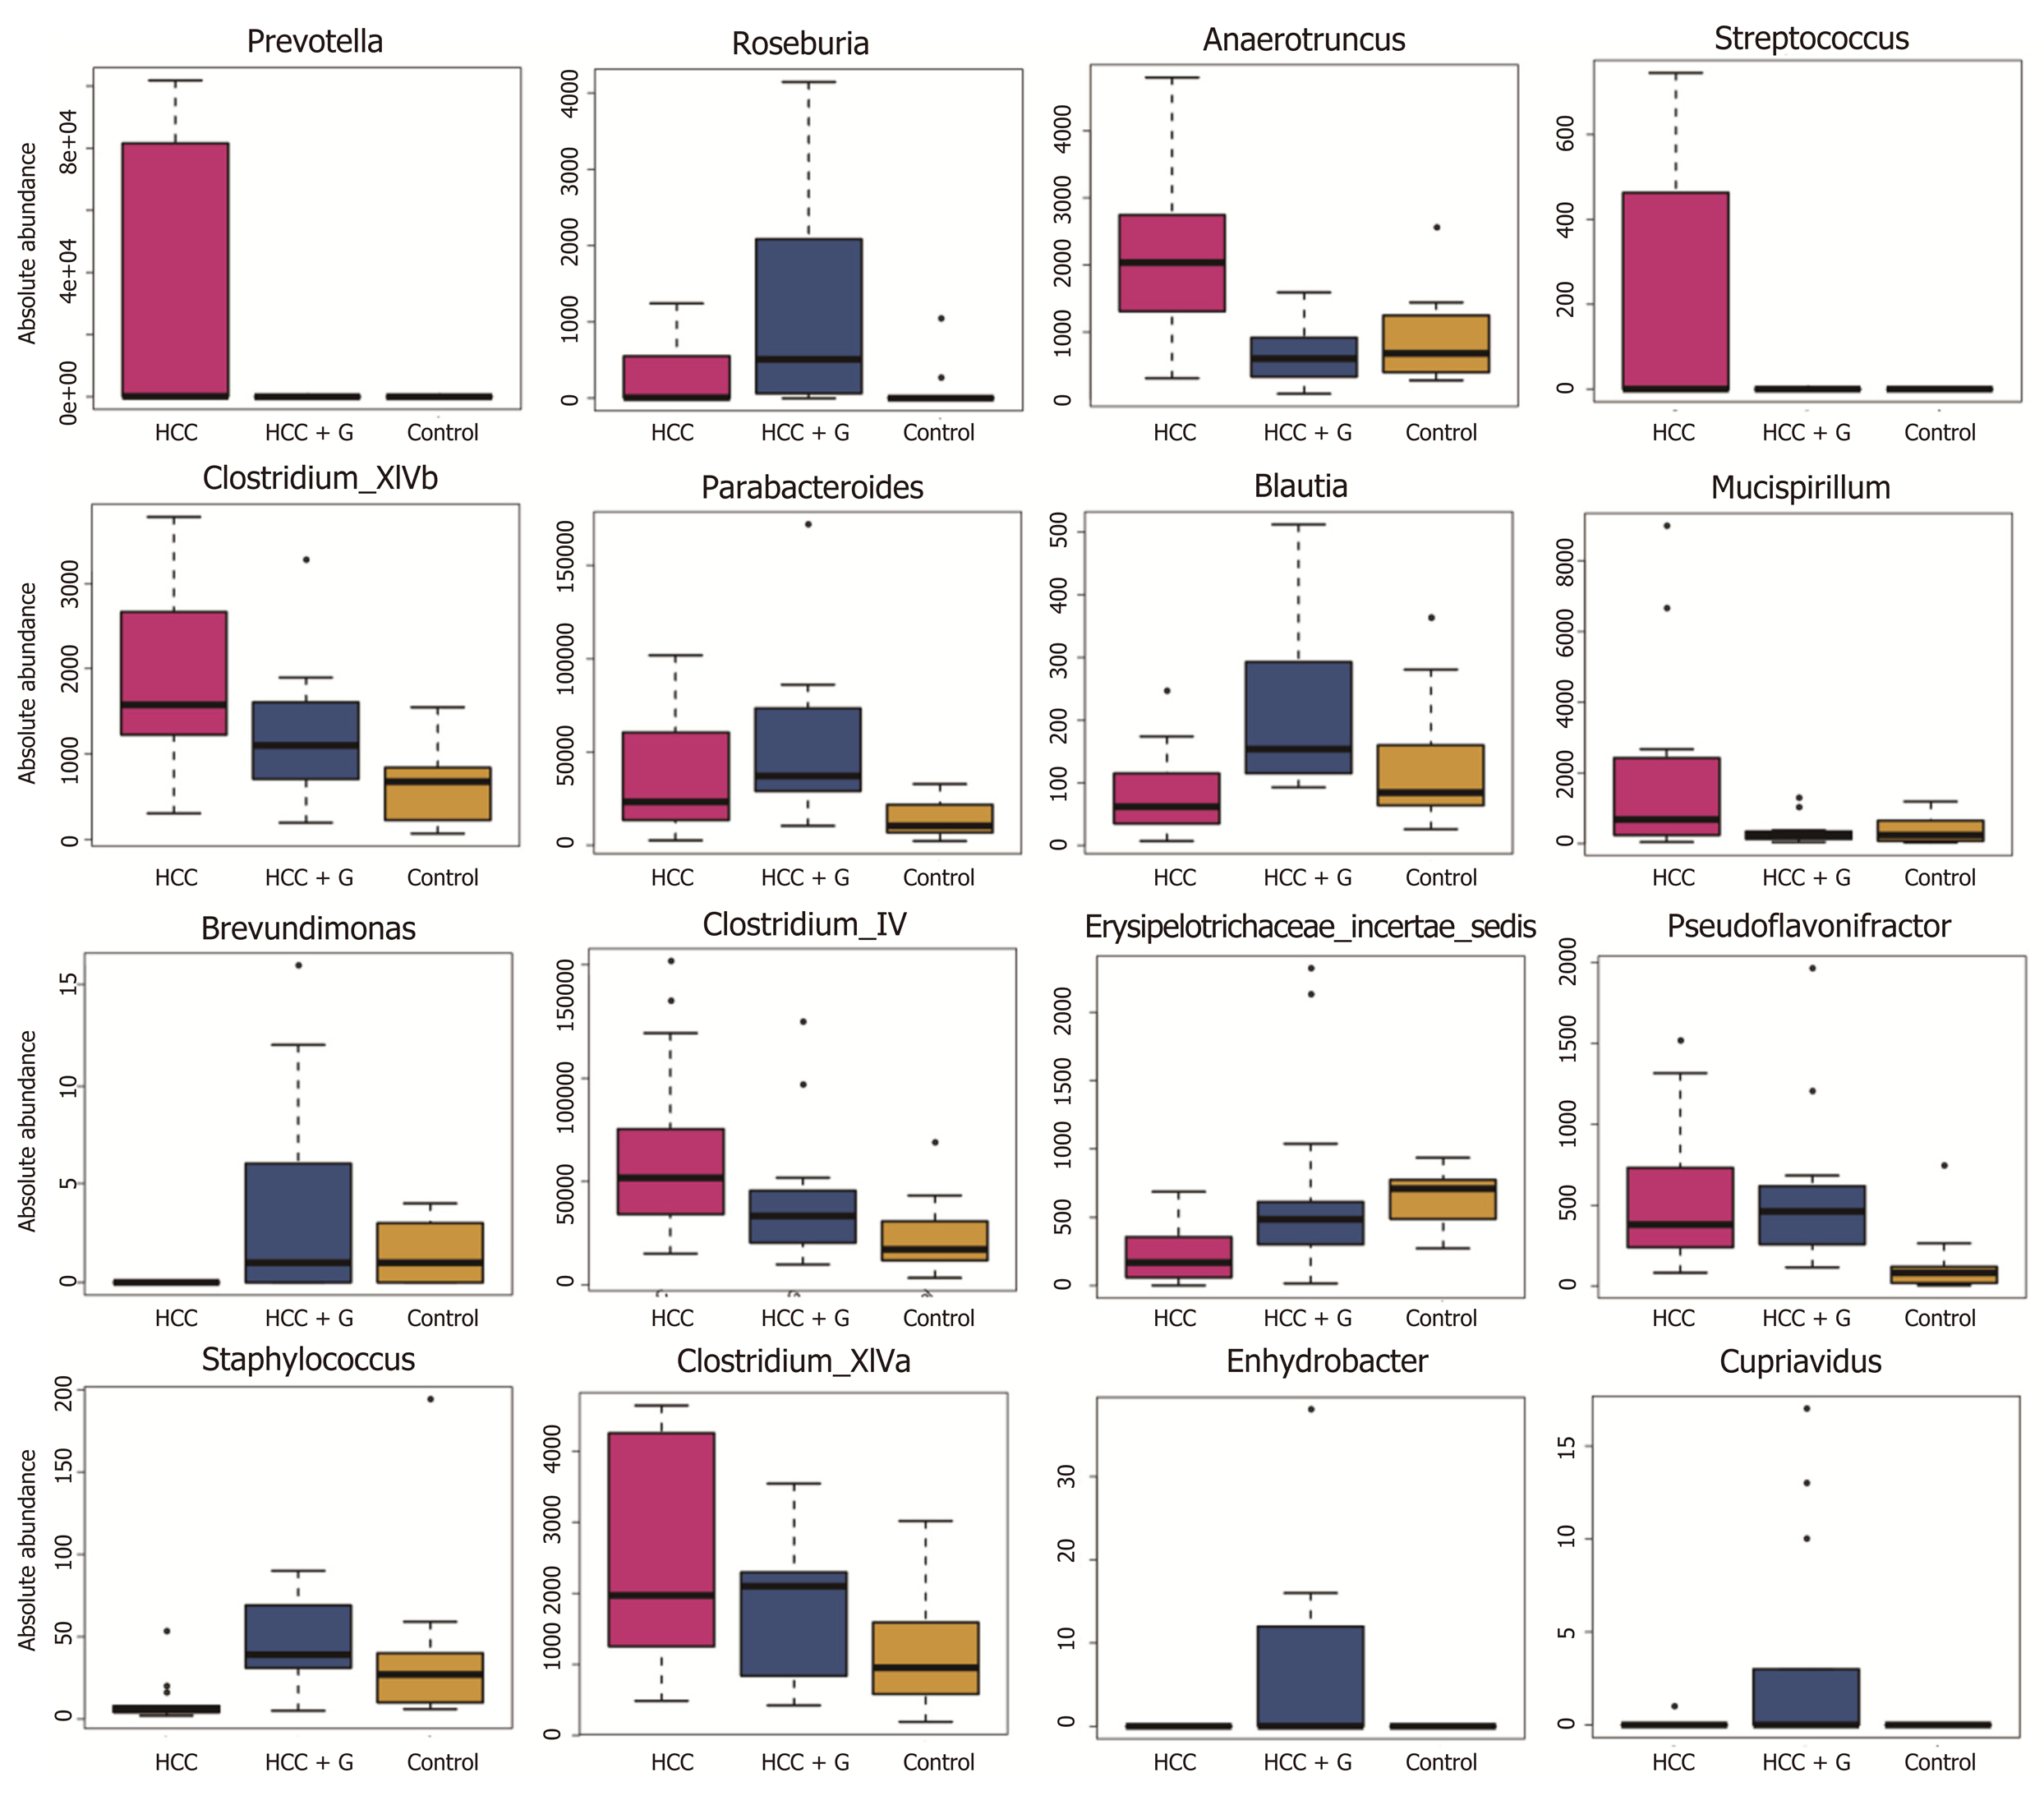
Figure 4 Profiles of the gut microbes among the hepatocellular carcinoma + granulocyte-macrophage colony-stimulating factor, hepatocellular carcinoma and control groups.
The absolute abundance of each genus is indicated on the y-axis. The ordinate represents the abundance value among the three groups. The Kruskal-Wallis rank-sum test was used to analyze the different species. The figure shows all the significantly different genera in the diversity indexes among the groups, and a P value < 0.05 was considered significantly different. HCC: Hepatocellular carcinoma; GM-CSF: Granulocyte-macrophage colony-stimulating factor.
- Citation: Wu YN, Zhang L, Chen T, Li X, He LH, Liu GX. Granulocyte-macrophage colony-stimulating factor protects mice against hepatocellular carcinoma by ameliorating intestinal dysbiosis and attenuating inflammation. World J Gastroenterol 2020; 26(36): 5420-5436
- URL: https://www.wjgnet.com/1007-9327/full/v26/i36/5420.htm
- DOI: https://dx.doi.org/10.3748/wjg.v26.i36.5420


