Copyright
©The Author(s) 2020.
World J Gastroenterol. Sep 14, 2020; 26(34): 5130-5145
Published online Sep 14, 2020. doi: 10.3748/wjg.v26.i34.5130
Published online Sep 14, 2020. doi: 10.3748/wjg.v26.i34.5130
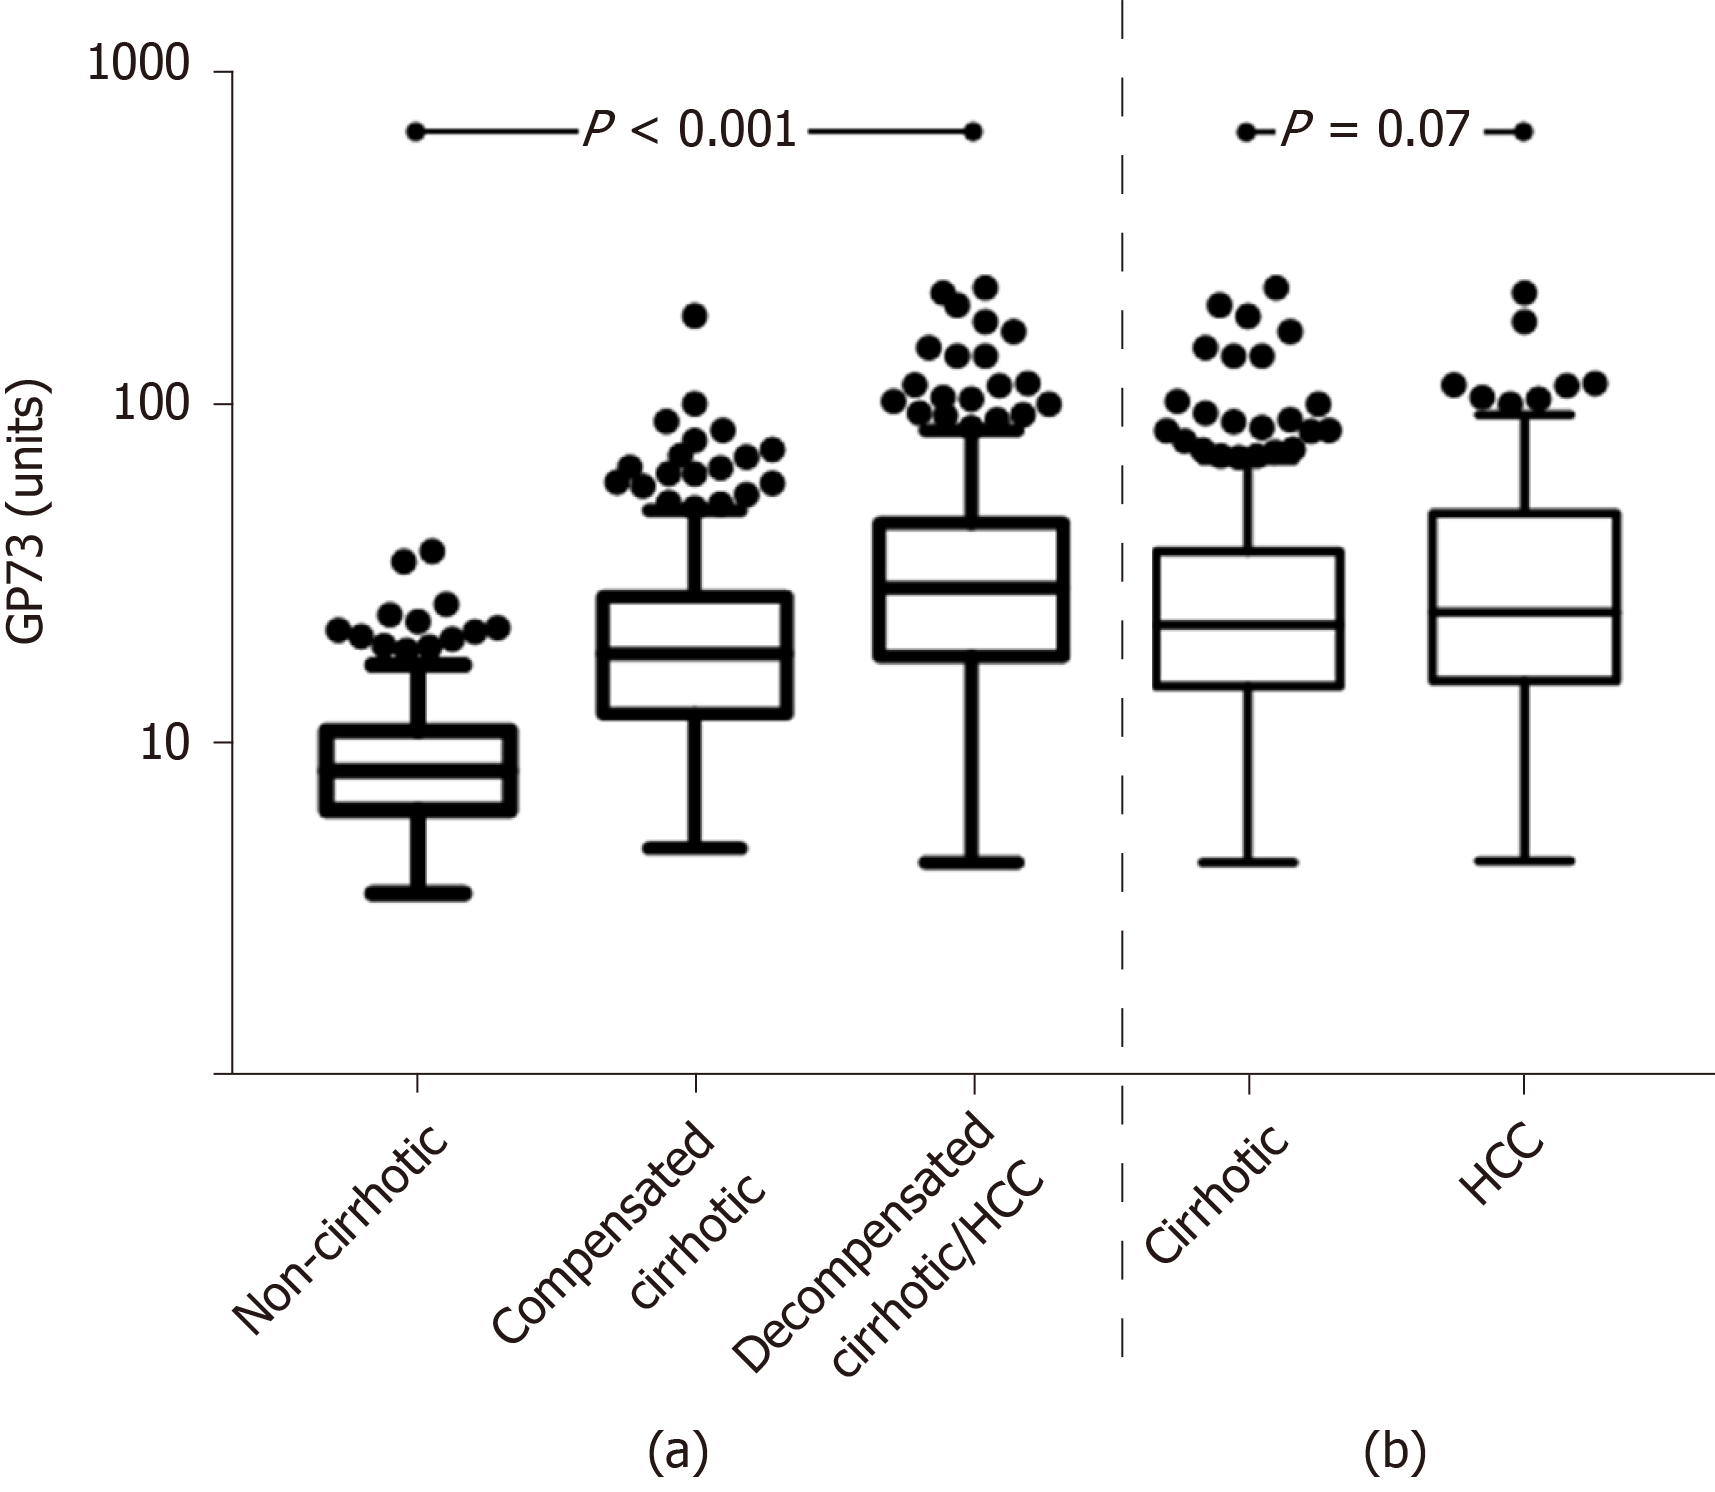
Figure 2 Golgi protein 73 values distribution in different stages of chronic liver diseases.
(a) non-cirrhotic patients, 8.4 (4.6) units vs compensated cirrhotic patients, 18.7 (15.3) units vs decompensated cirrhotic or patients with hepatocellular carcinoma (HCC), 29.5 (27.6) units; P < 0.001; and (b) cirrhotic (compensated and decompensated), 22.8 (22.9) units vs HCC patients, 25 (33.7) units; P = 0.07 (Tukey box-and-whisker plots; y-axis is presented in log scale). GP73: Golgi protein 73; HCC: Hepatocellular carcinoma.
- Citation: Gatselis NK, Tornai T, Shums Z, Zachou K, Saitis A, Gabeta S, Albesa R, Norman GL, Papp M, Dalekos GN. Golgi protein-73: A biomarker for assessing cirrhosis and prognosis of liver disease patients. World J Gastroenterol 2020; 26(34): 5130-5145
- URL: https://www.wjgnet.com/1007-9327/full/v26/i34/5130.htm
- DOI: https://dx.doi.org/10.3748/wjg.v26.i34.5130


