Copyright
©The Author(s) 2020.
World J Gastroenterol. Aug 7, 2020; 26(29): 4356-4371
Published online Aug 7, 2020. doi: 10.3748/wjg.v26.i29.4356
Published online Aug 7, 2020. doi: 10.3748/wjg.v26.i29.4356
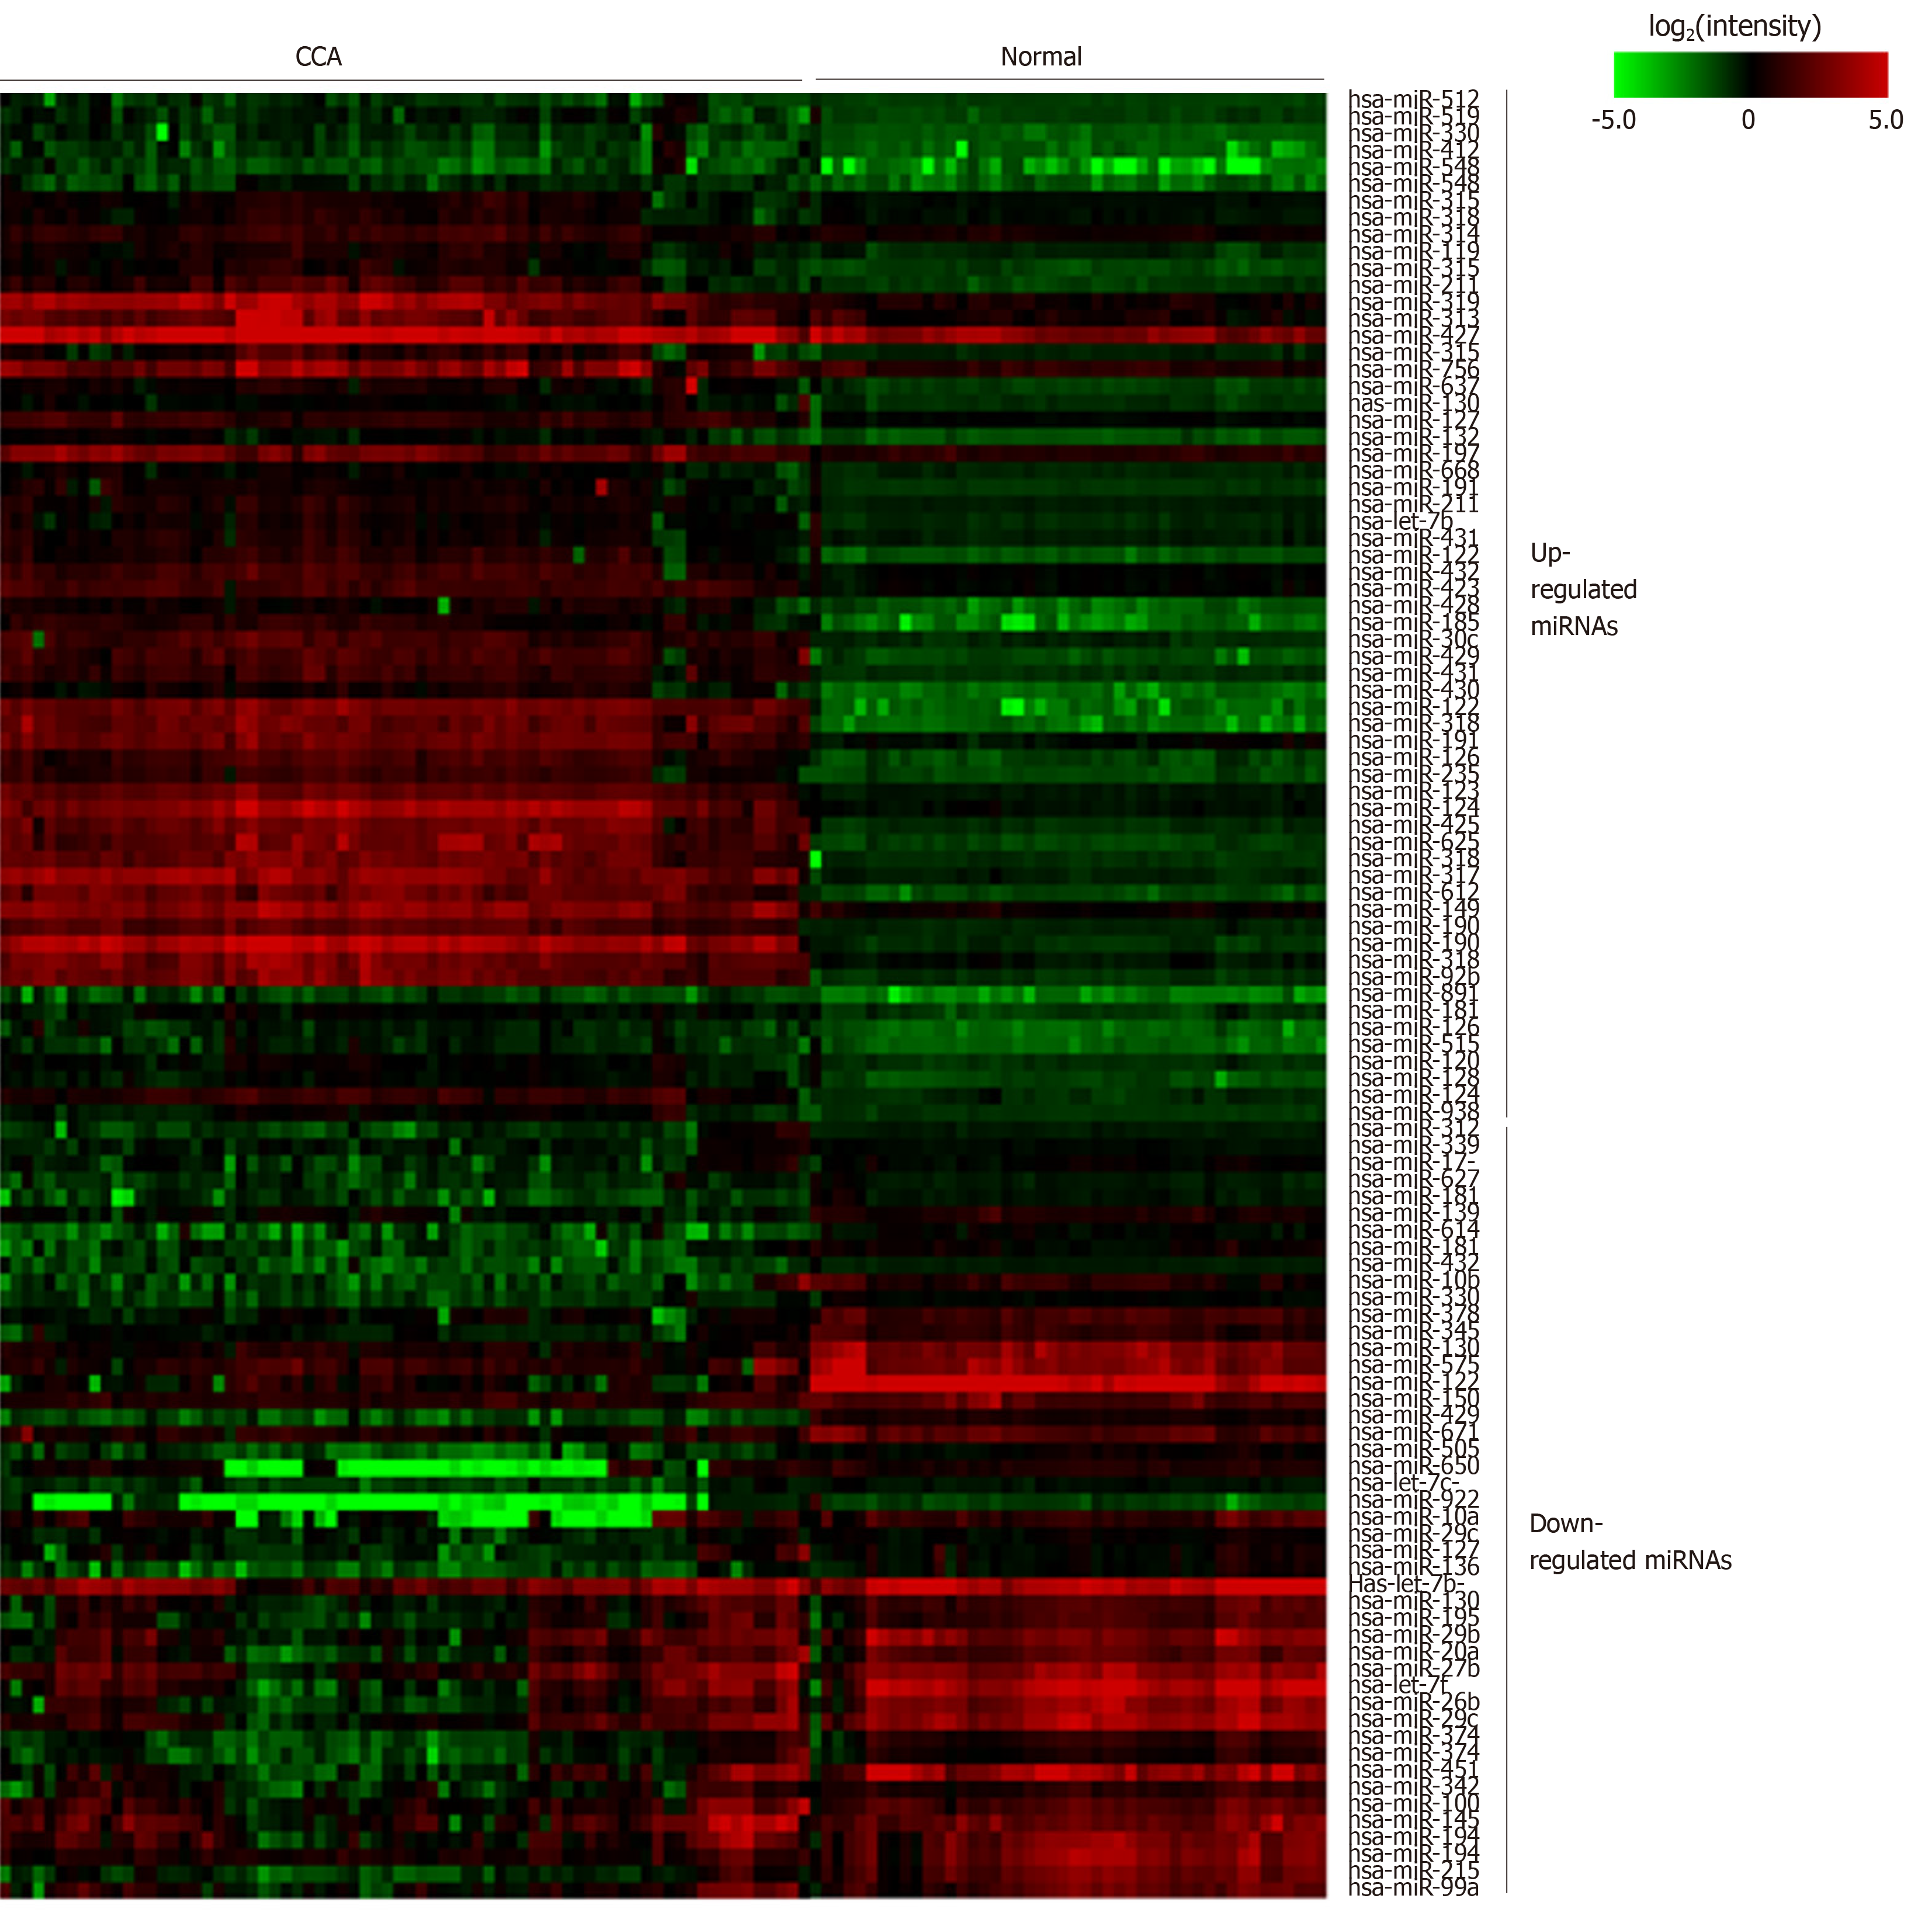
Figure 2 Heatmap of microRNA expression in cholangiocarcinoma and normal samples.
The color gradient of each cell represents the log2 of normalized intensity value of microRNA microarray spot. CCA: Cholangiocarcinoma; miRNA: MicroRNA.
- Citation: Likhitrattanapisal S, Kumkate S, Ajawatanawong P, Wongprasert K, Tohtong R, Janvilisri T. Dysregulation of microRNA in cholangiocarcinoma identified through a meta-analysis of microRNA profiling. World J Gastroenterol 2020; 26(29): 4356-4371
- URL: https://www.wjgnet.com/1007-9327/full/v26/i29/4356.htm
- DOI: https://dx.doi.org/10.3748/wjg.v26.i29.4356


