Copyright
©The Author(s) 2020.
World J Gastroenterol. Aug 7, 2020; 26(29): 4272-4287
Published online Aug 7, 2020. doi: 10.3748/wjg.v26.i29.4272
Published online Aug 7, 2020. doi: 10.3748/wjg.v26.i29.4272
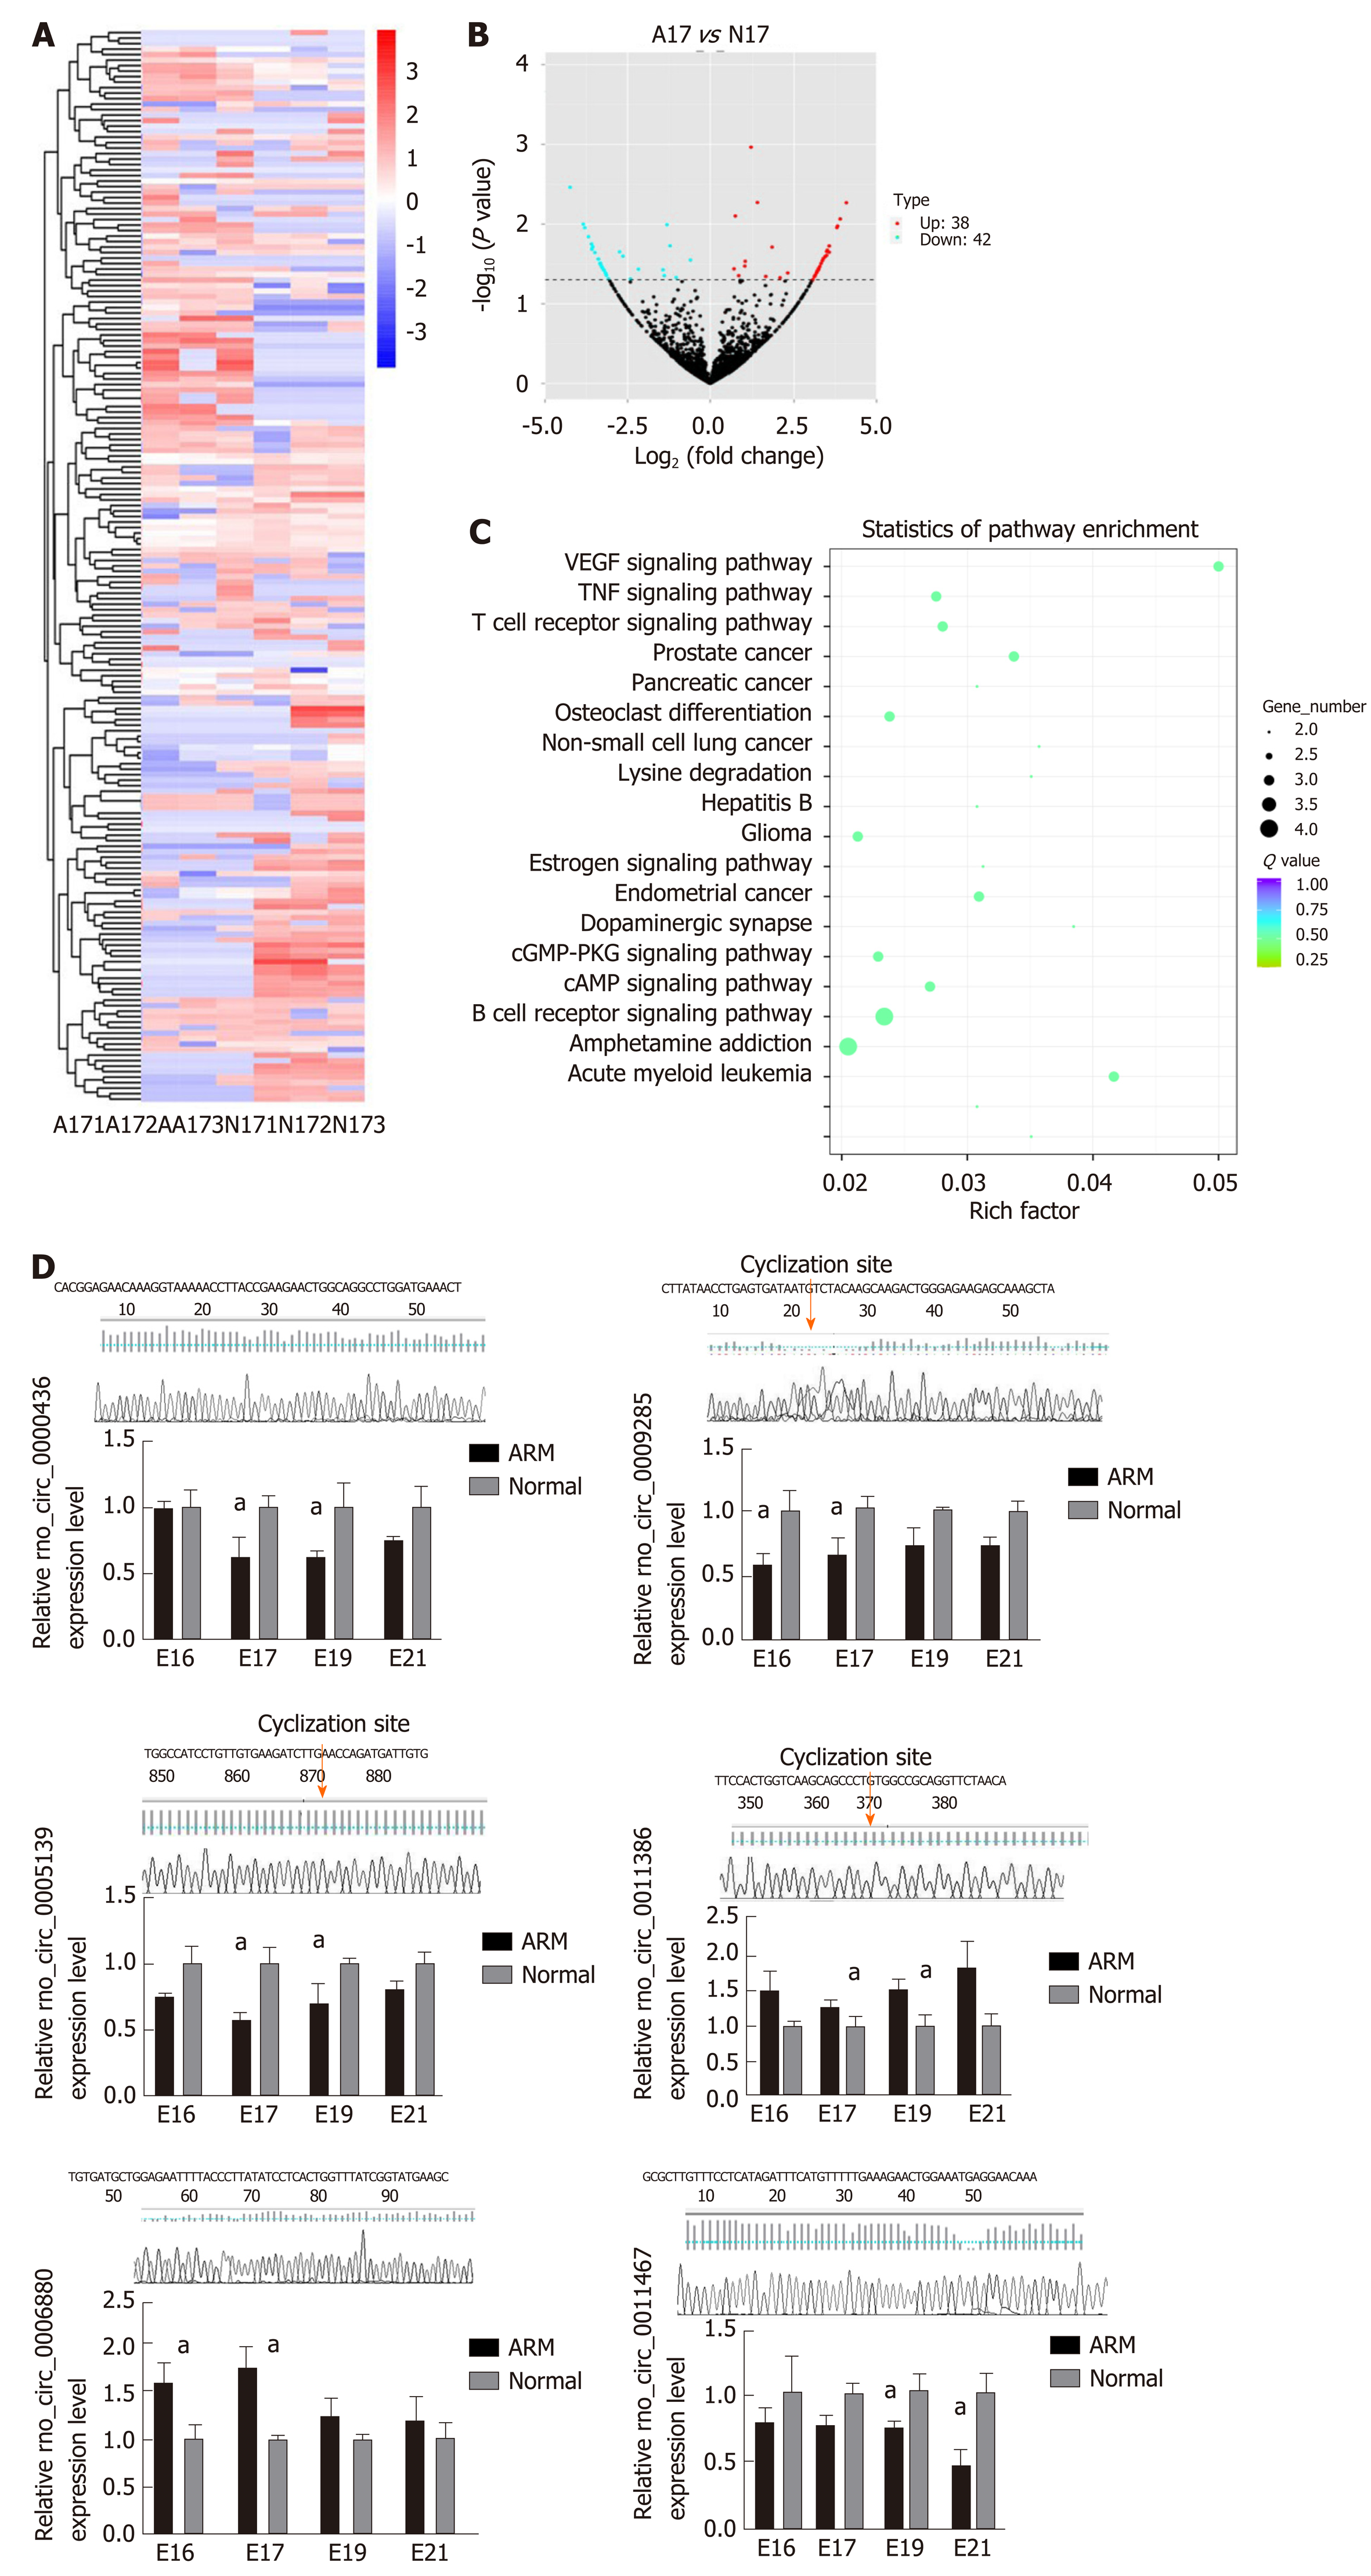
Figure 1 Identification of differentially expressed circular RNAs between anorectal malformations anorectal tissues and control anorectal tissues.
A: Cluster analysis of differentially expressed circular RNAs (circRNAs) presented as a heatmap. Red indicates high expression and blue indicates low expression [red to blue represent high to low log10 (transcripts per million + 1) values]; B: Volcano plot of 38 up-regulated (red) and 42 down-regulated (green) circRNAs on embryonic day 17 (E17) in anorectal malformations (ARM) anorectal tissues compared with control tissues showing a two-fold change; C: Vertical axis represents the pathway name, and horizontal axis represents the enrichment factor. The size of the dots indicates the number of parent genes in this pathway, and the color of the dots indicates different q-value ranges; D: circRNA rno_circ_0000436, rno_circ_0005139, rno_circ_0006880, rno_circ_0009285, rno_circ_0011386, and rno_circ_0014367 were evaluated using quantitative reverse transcription polymerase chain reaction in ARM and control anorectal tissues. aP < 0.05 vs normal. A: Anorectal malformations; ARM: Anorectal malformations; E: Embryonic day; N: Normal control.
- Citation: Liu D, Qu Y, Cao ZN, Jia HM. Rno_circ_0005139 regulates apoptosis by targeting Wnt5a in rat anorectal malformations. World J Gastroenterol 2020; 26(29): 4272-4287
- URL: https://www.wjgnet.com/1007-9327/full/v26/i29/4272.htm
- DOI: https://dx.doi.org/10.3748/wjg.v26.i29.4272


