Copyright
©The Author(s) 2020.
World J Gastroenterol. Jul 28, 2020; 26(28): 4094-4107
Published online Jul 28, 2020. doi: 10.3748/wjg.v26.i28.4094
Published online Jul 28, 2020. doi: 10.3748/wjg.v26.i28.4094
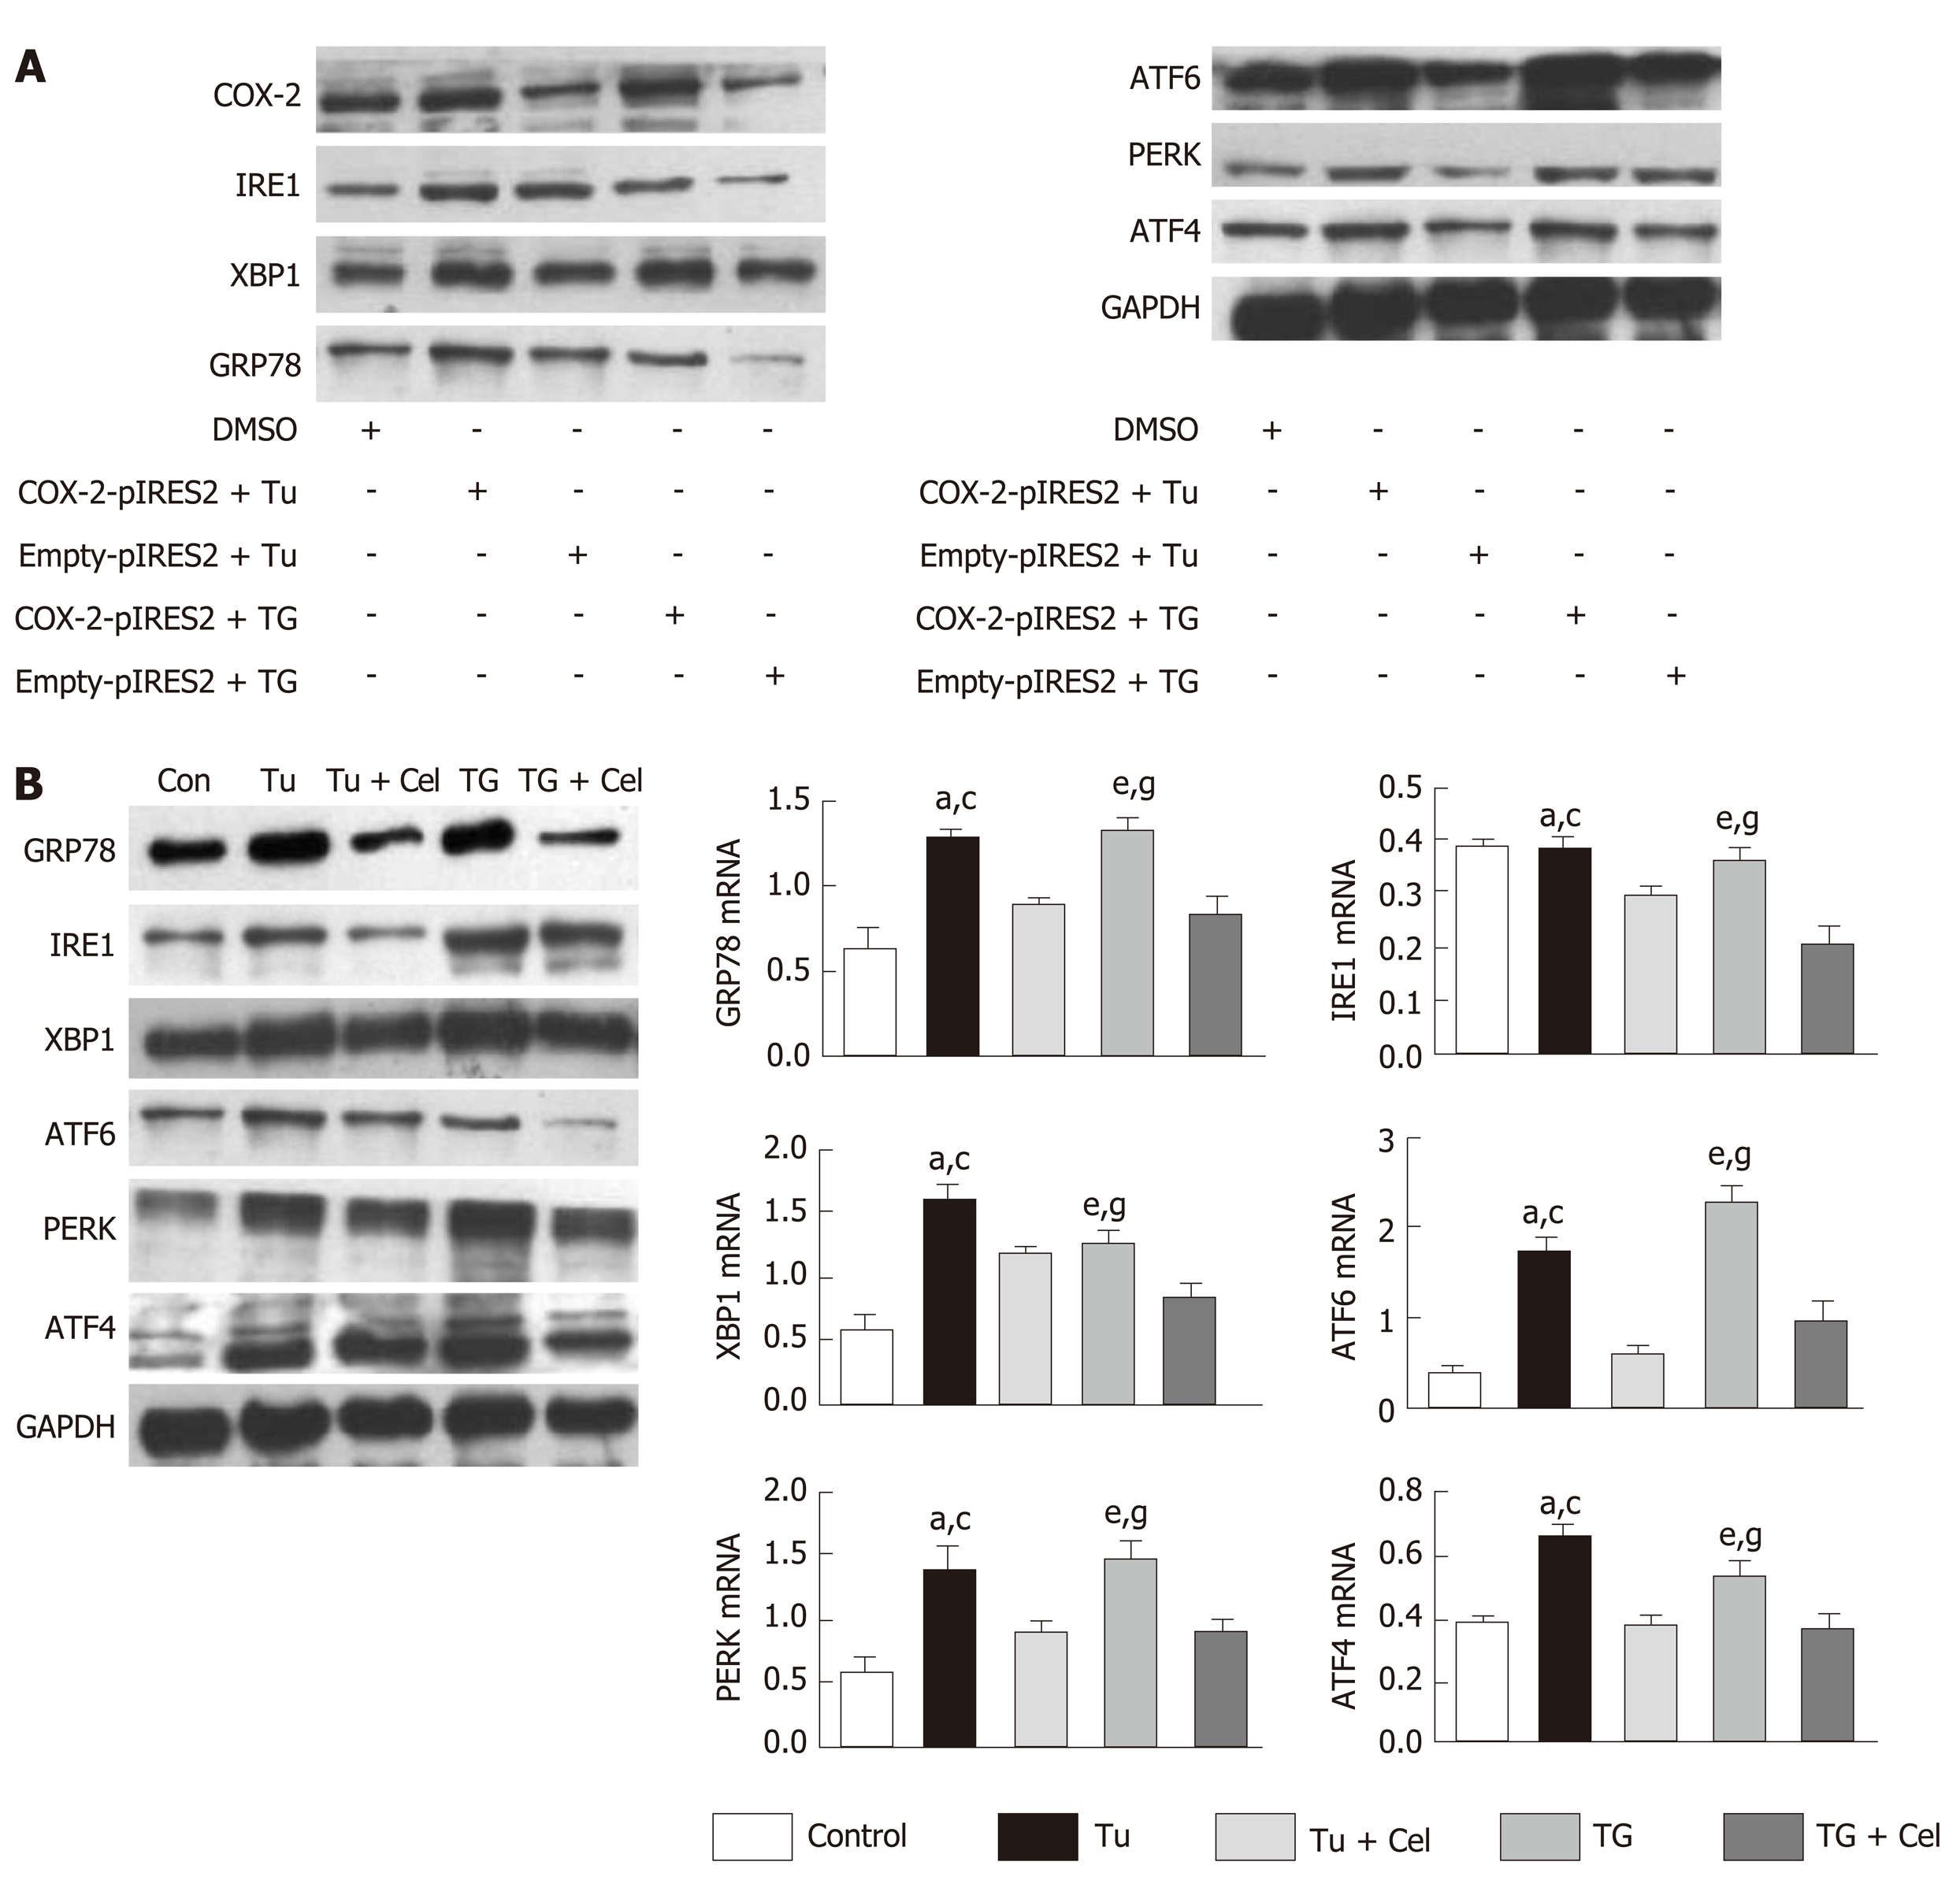
Figure 5 Celecoxib regulates the endoplasmic reticulum stress signaling pathway.
A: Western blot analysis of glucose-regulated protein 78 (GRP78), inositol enzyme 1 (IRE1), X-box binding protein 1 (XBP1), activated transcription factor 6 (ATF6), PKR-like endoplasmic reticulum protein kinase (PERK), and ATF4 levels in L02 cells transfected with a cyclooxygenase 2 (COX-2) expressing plasmid and treated with endoplasmic reticulum stress inducers tunicamycin (Tu) and thapsigargin (TG); B: Western blot analysis of GRP78, IRE1, XBP1, ATF6, PERK and ATF4 levels in LO2 cells treated with celecoxib and/or Tu and TG. aP < 0.05 between Tu group and control group, cP < 0.05 between Tu group and Tu + celecoxib group, eP < 0.05 between TG group and control group, gP < 0.05 between TG group and control group TG + celecoxib group (n = 6). Con: Control; Tu: Tunicamycin; TG: Thapsigargin; Tu + Cel: Tu + celecoxib; TG + Cel: TG + celecoxib; GAPDH: Glyceraldehyde-3-phosphate dehydrogenase; GRP78: Glucose-regulated protein 78; ATF6: Activating transcription factor 6; PERK: PKR-like endoplasmic reticulum protein kinase; XBP1: X-box binding protein-1; IRE1: Inositol-requiring enzyme 1; TAA: Thioacetamide; COX-2: Cyclooxygenase-2.
- Citation: Su W, Tai Y, Tang SH, Ye YT, Zhao C, Gao JH, Tuo BG, Tang CW. Celecoxib attenuates hepatocyte apoptosis by inhibiting endoplasmic reticulum stress in thioacetamide-induced cirrhotic rats. World J Gastroenterol 2020; 26(28): 4094-4107
- URL: https://www.wjgnet.com/1007-9327/full/v26/i28/4094.htm
- DOI: https://dx.doi.org/10.3748/wjg.v26.i28.4094


