Copyright
©The Author(s) 2020.
World J Gastroenterol. Jun 7, 2020; 26(21): 2821-2830
Published online Jun 7, 2020. doi: 10.3748/wjg.v26.i21.2821
Published online Jun 7, 2020. doi: 10.3748/wjg.v26.i21.2821
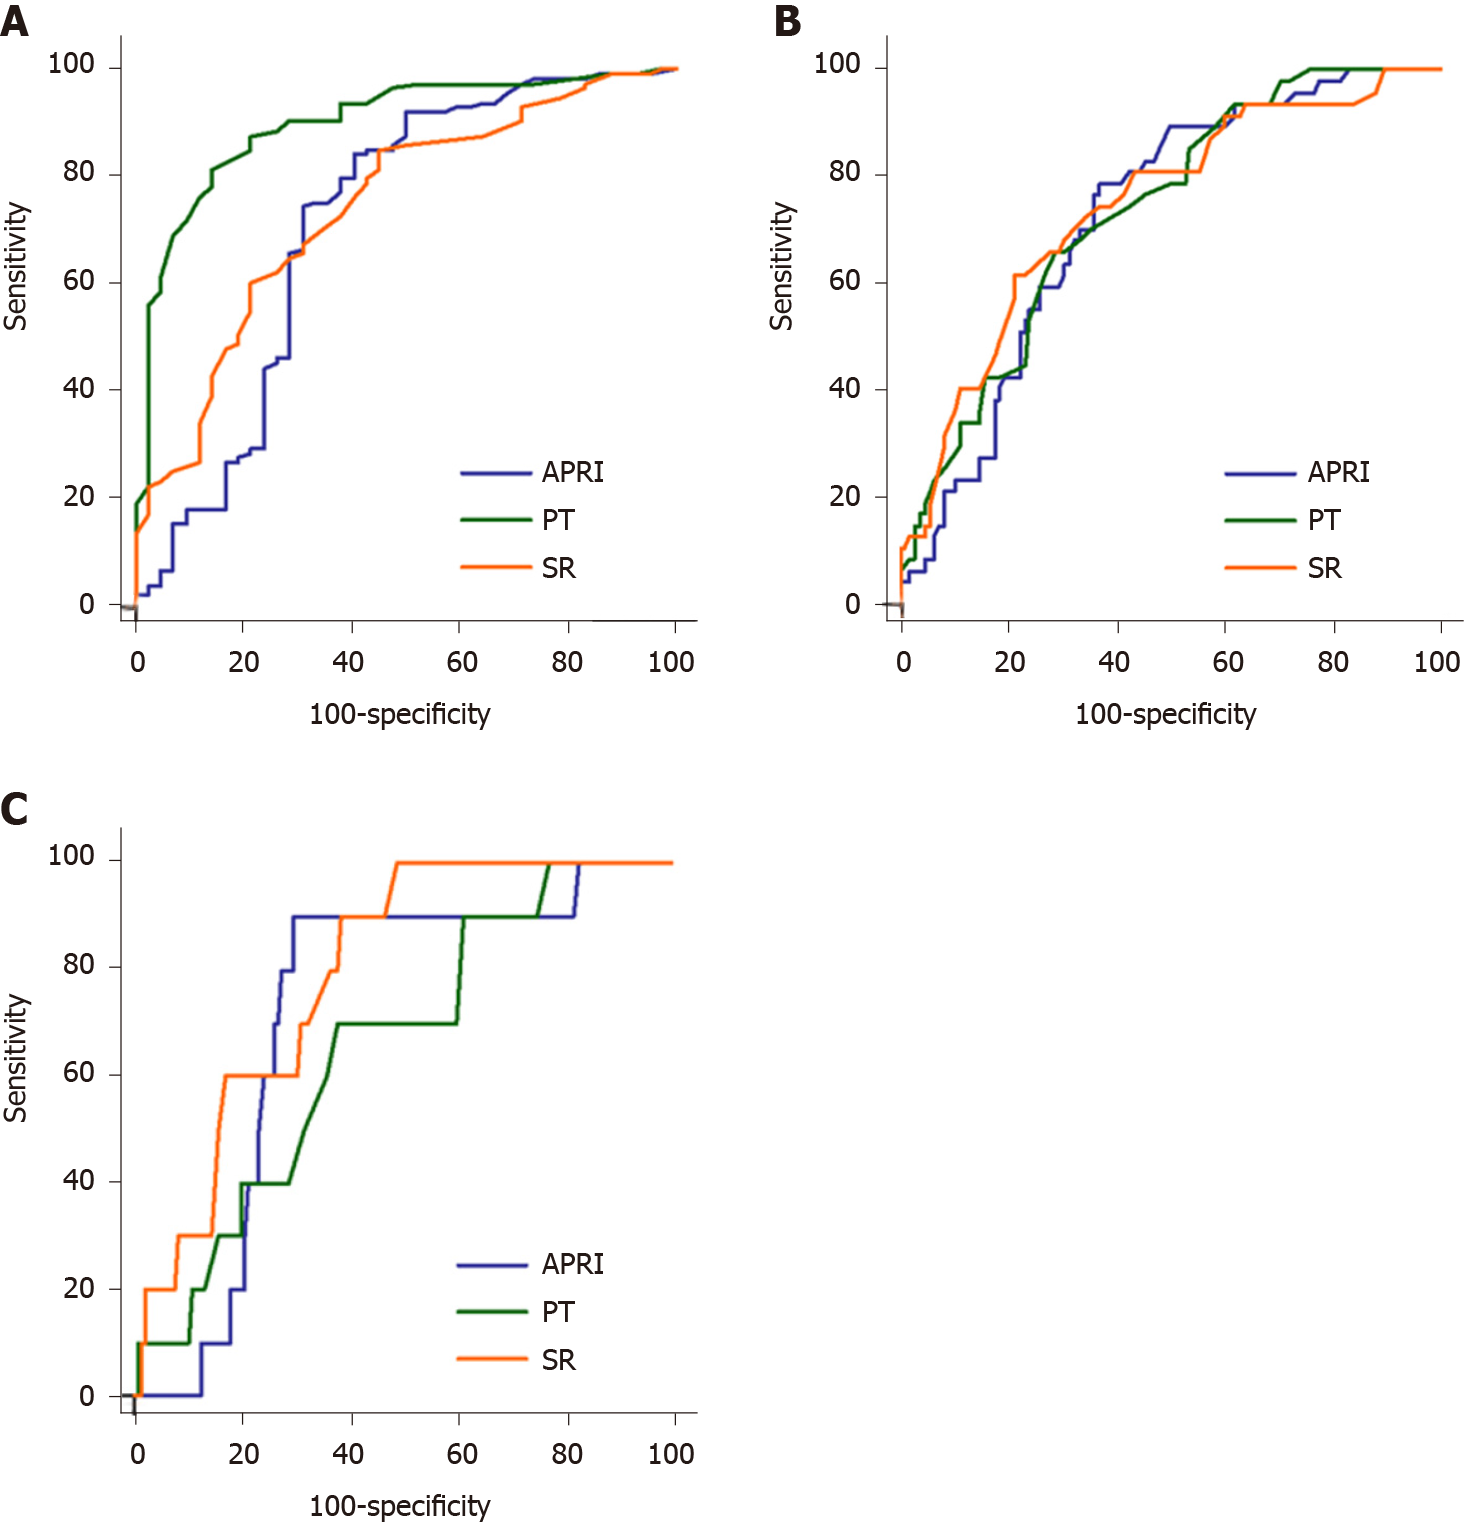
Figure 3 Comparisons of receiver operating characteristic curves.
The comparisons of area under the curve (AUC) for diagnosing A: Clinically significant fibrosis (F2-F4); B: Advance fibrosis (F3-F4); C: Cirrhosis (F4) with periportal thickening (PT, green line), normalized spleen size ratio (SR, orange line), and aspartate aminotransferase to platelet ratio index (APRI, blue line). The AUC of PT for diagnosing clinically significant fibrosis was higher than that of SR or APRI. However, the AUCs were not different for differentiating advanced fibrosis. For diagnosing cirrhosis, SR had higher AUC value than PT. APRI: Aspartate aminotransferase to platelet ratio index; SR: Normalized spleen size ratio; PT: Periportal thickening.
- Citation: Lee MH, Shin HJ, Yoon H, Han SJ, Koh H, Lee MJ. Periportal thickening on magnetic resonance imaging for hepatic fibrosis in infantile cholestasis. World J Gastroenterol 2020; 26(21): 2821-2830
- URL: https://www.wjgnet.com/1007-9327/full/v26/i21/2821.htm
- DOI: https://dx.doi.org/10.3748/wjg.v26.i21.2821


