Copyright
©The Author(s) 2020.
World J Gastroenterol. May 28, 2020; 26(20): 2584-2598
Published online May 28, 2020. doi: 10.3748/wjg.v26.i20.2584
Published online May 28, 2020. doi: 10.3748/wjg.v26.i20.2584
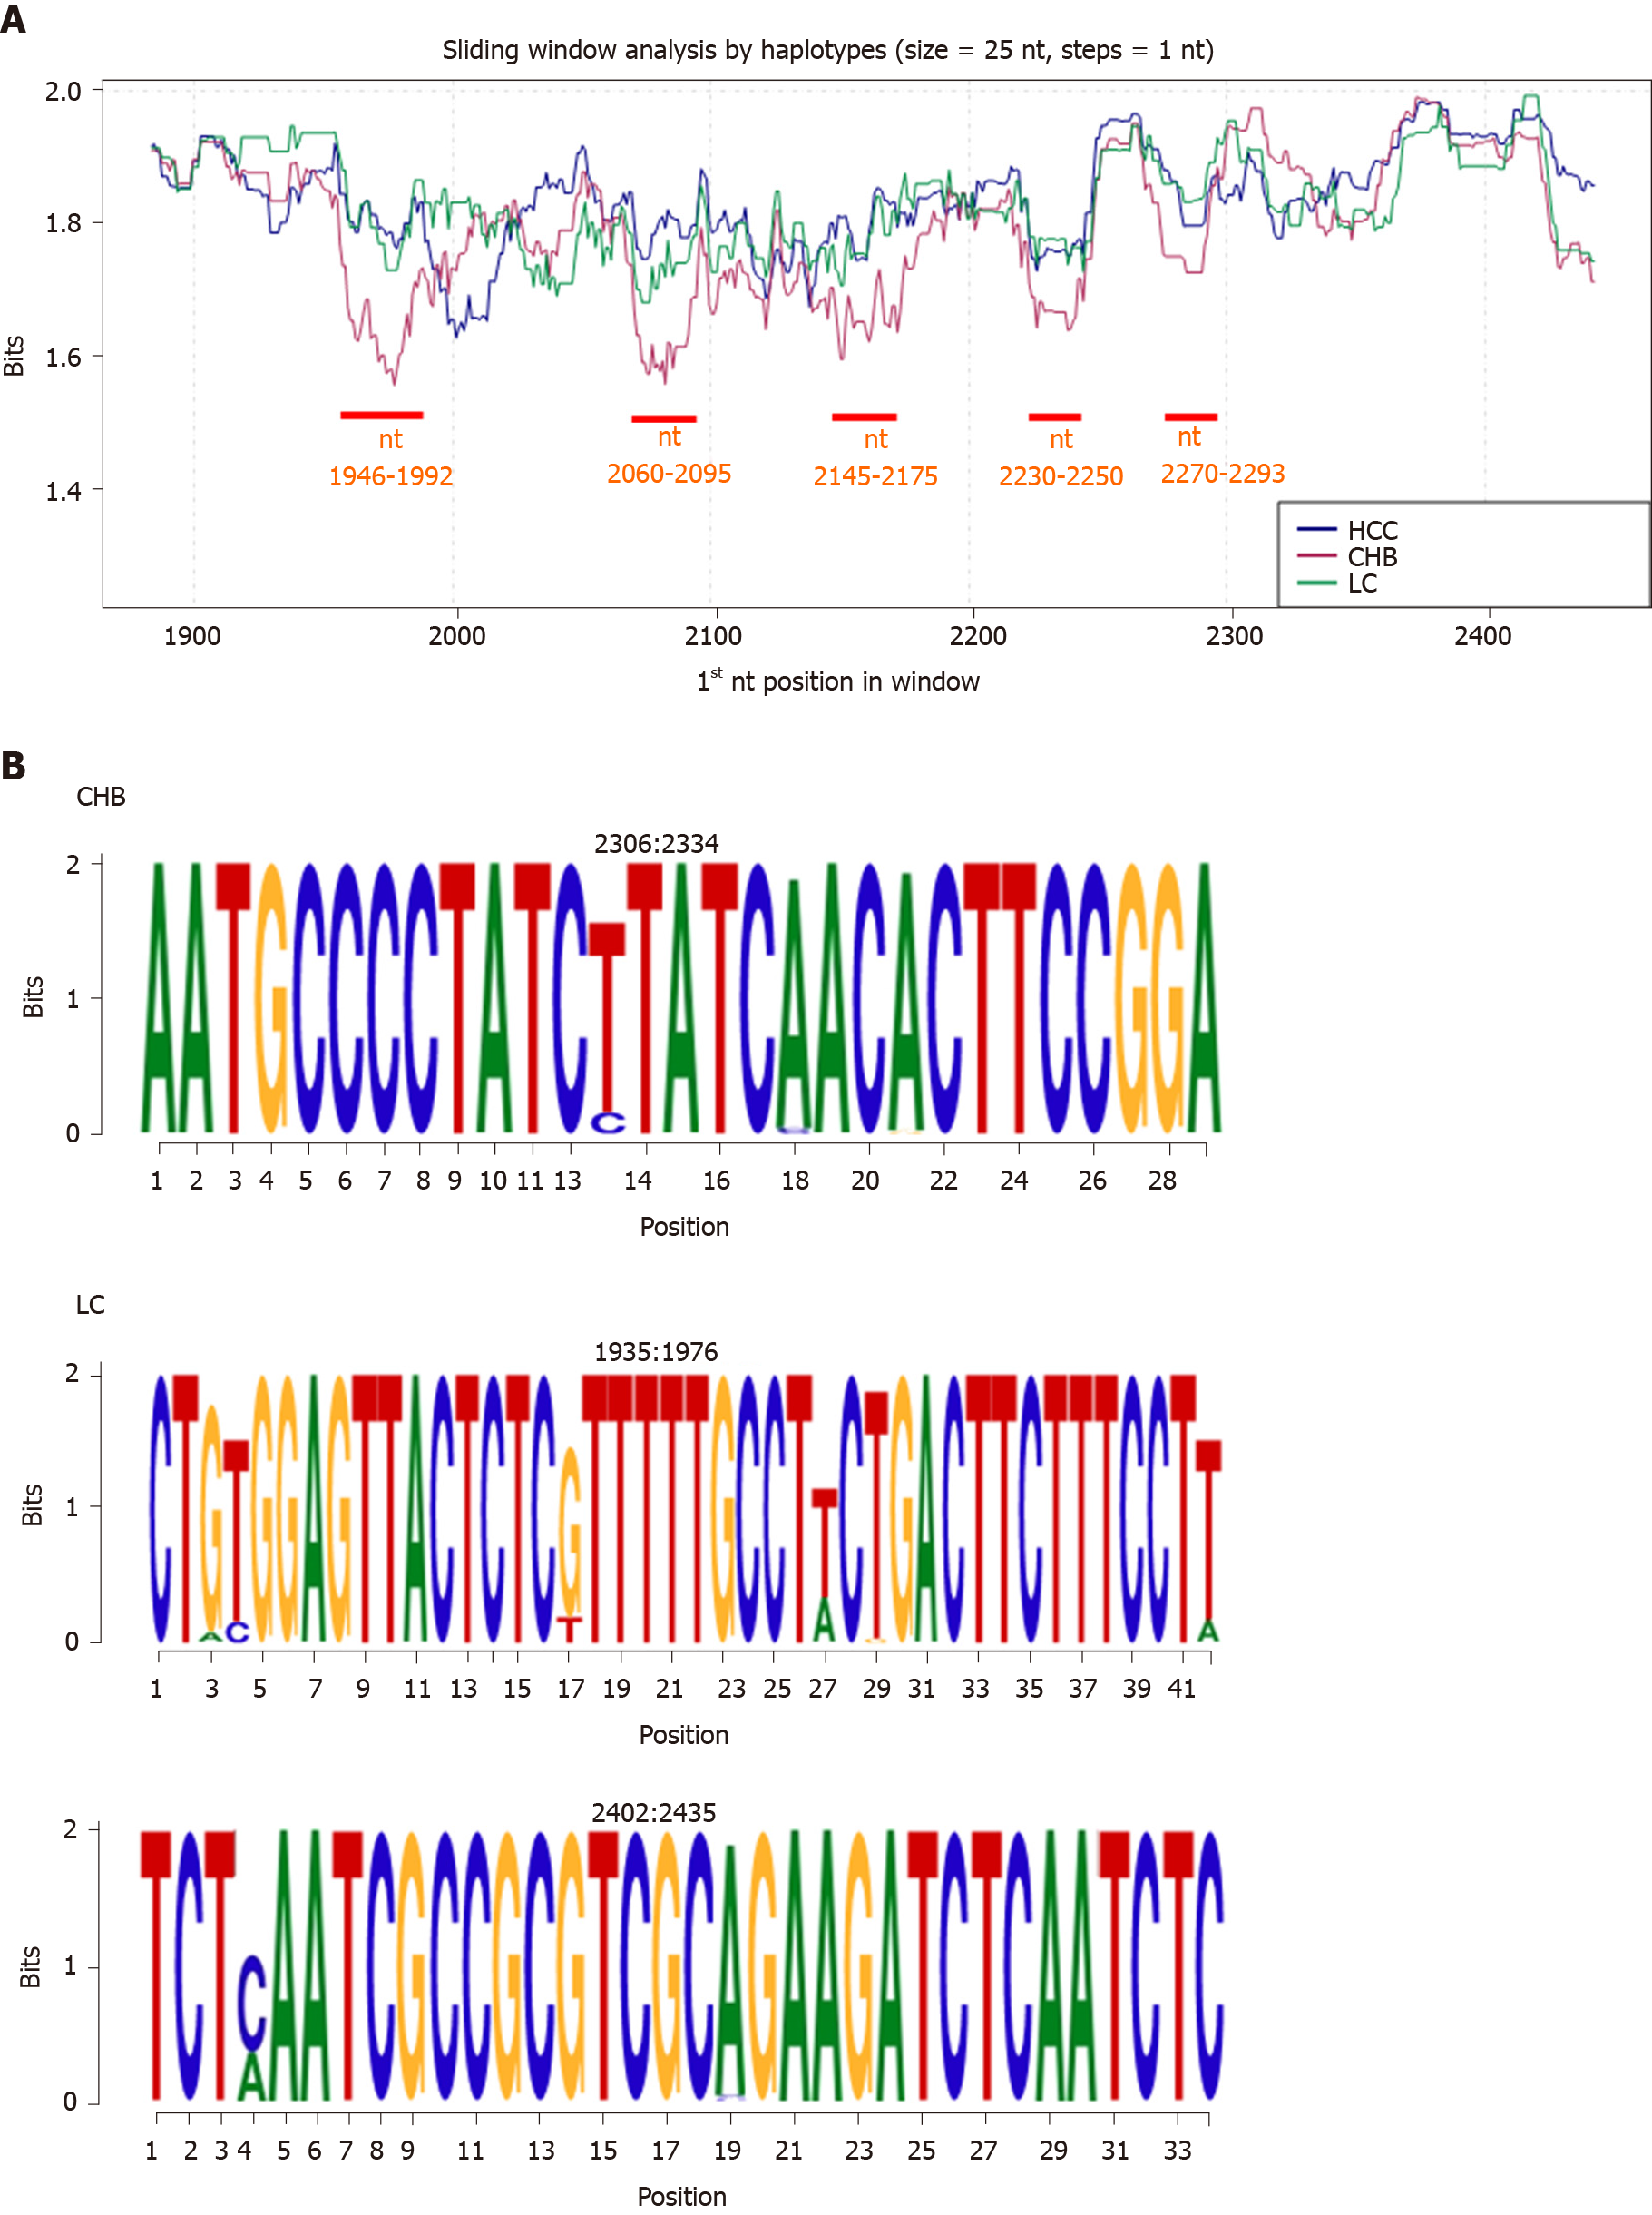
Figure 3 Information content analysis at nucleotide level by clinical stage group.
A: By-haplotype sliding window analysis of the Hepatitis B core gene according to different clinical groups (HCC in blue, CHB in red, and LC in green). The portions and positions where CHB showed lower levels of conservation than the others (P < 0.05) are shown in red. B: Representation of the information content of CHB- and LC-specific conserved nucleotide regions as sequence logos. Positions are reported at the top of each logo. CHB: Chronic hepatitis B infection without liver damage; HCC: Hepatocellular carcinoma; LC: Liver cirrhosis; nt: Nucleotide; P: P value.
- Citation: Yll M, Cortese MF, Guerrero-Murillo M, Orriols G, Gregori J, Casillas R, González C, Sopena S, Godoy C, Vila M, Tabernero D, Quer J, Rando A, Lopez-Martinez R, Esteban R, Riveiro-Barciela M, Buti M, Rodríguez-Frías F. Conservation and variability of hepatitis B core at different chronic hepatitis stages. World J Gastroenterol 2020; 26(20): 2584-2598
- URL: https://www.wjgnet.com/1007-9327/full/v26/i20/2584.htm
- DOI: https://dx.doi.org/10.3748/wjg.v26.i20.2584


