Copyright
©The Author(s) 2020.
World J Gastroenterol. Jan 14, 2020; 26(2): 199-218
Published online Jan 14, 2020. doi: 10.3748/wjg.v26.i2.199
Published online Jan 14, 2020. doi: 10.3748/wjg.v26.i2.199
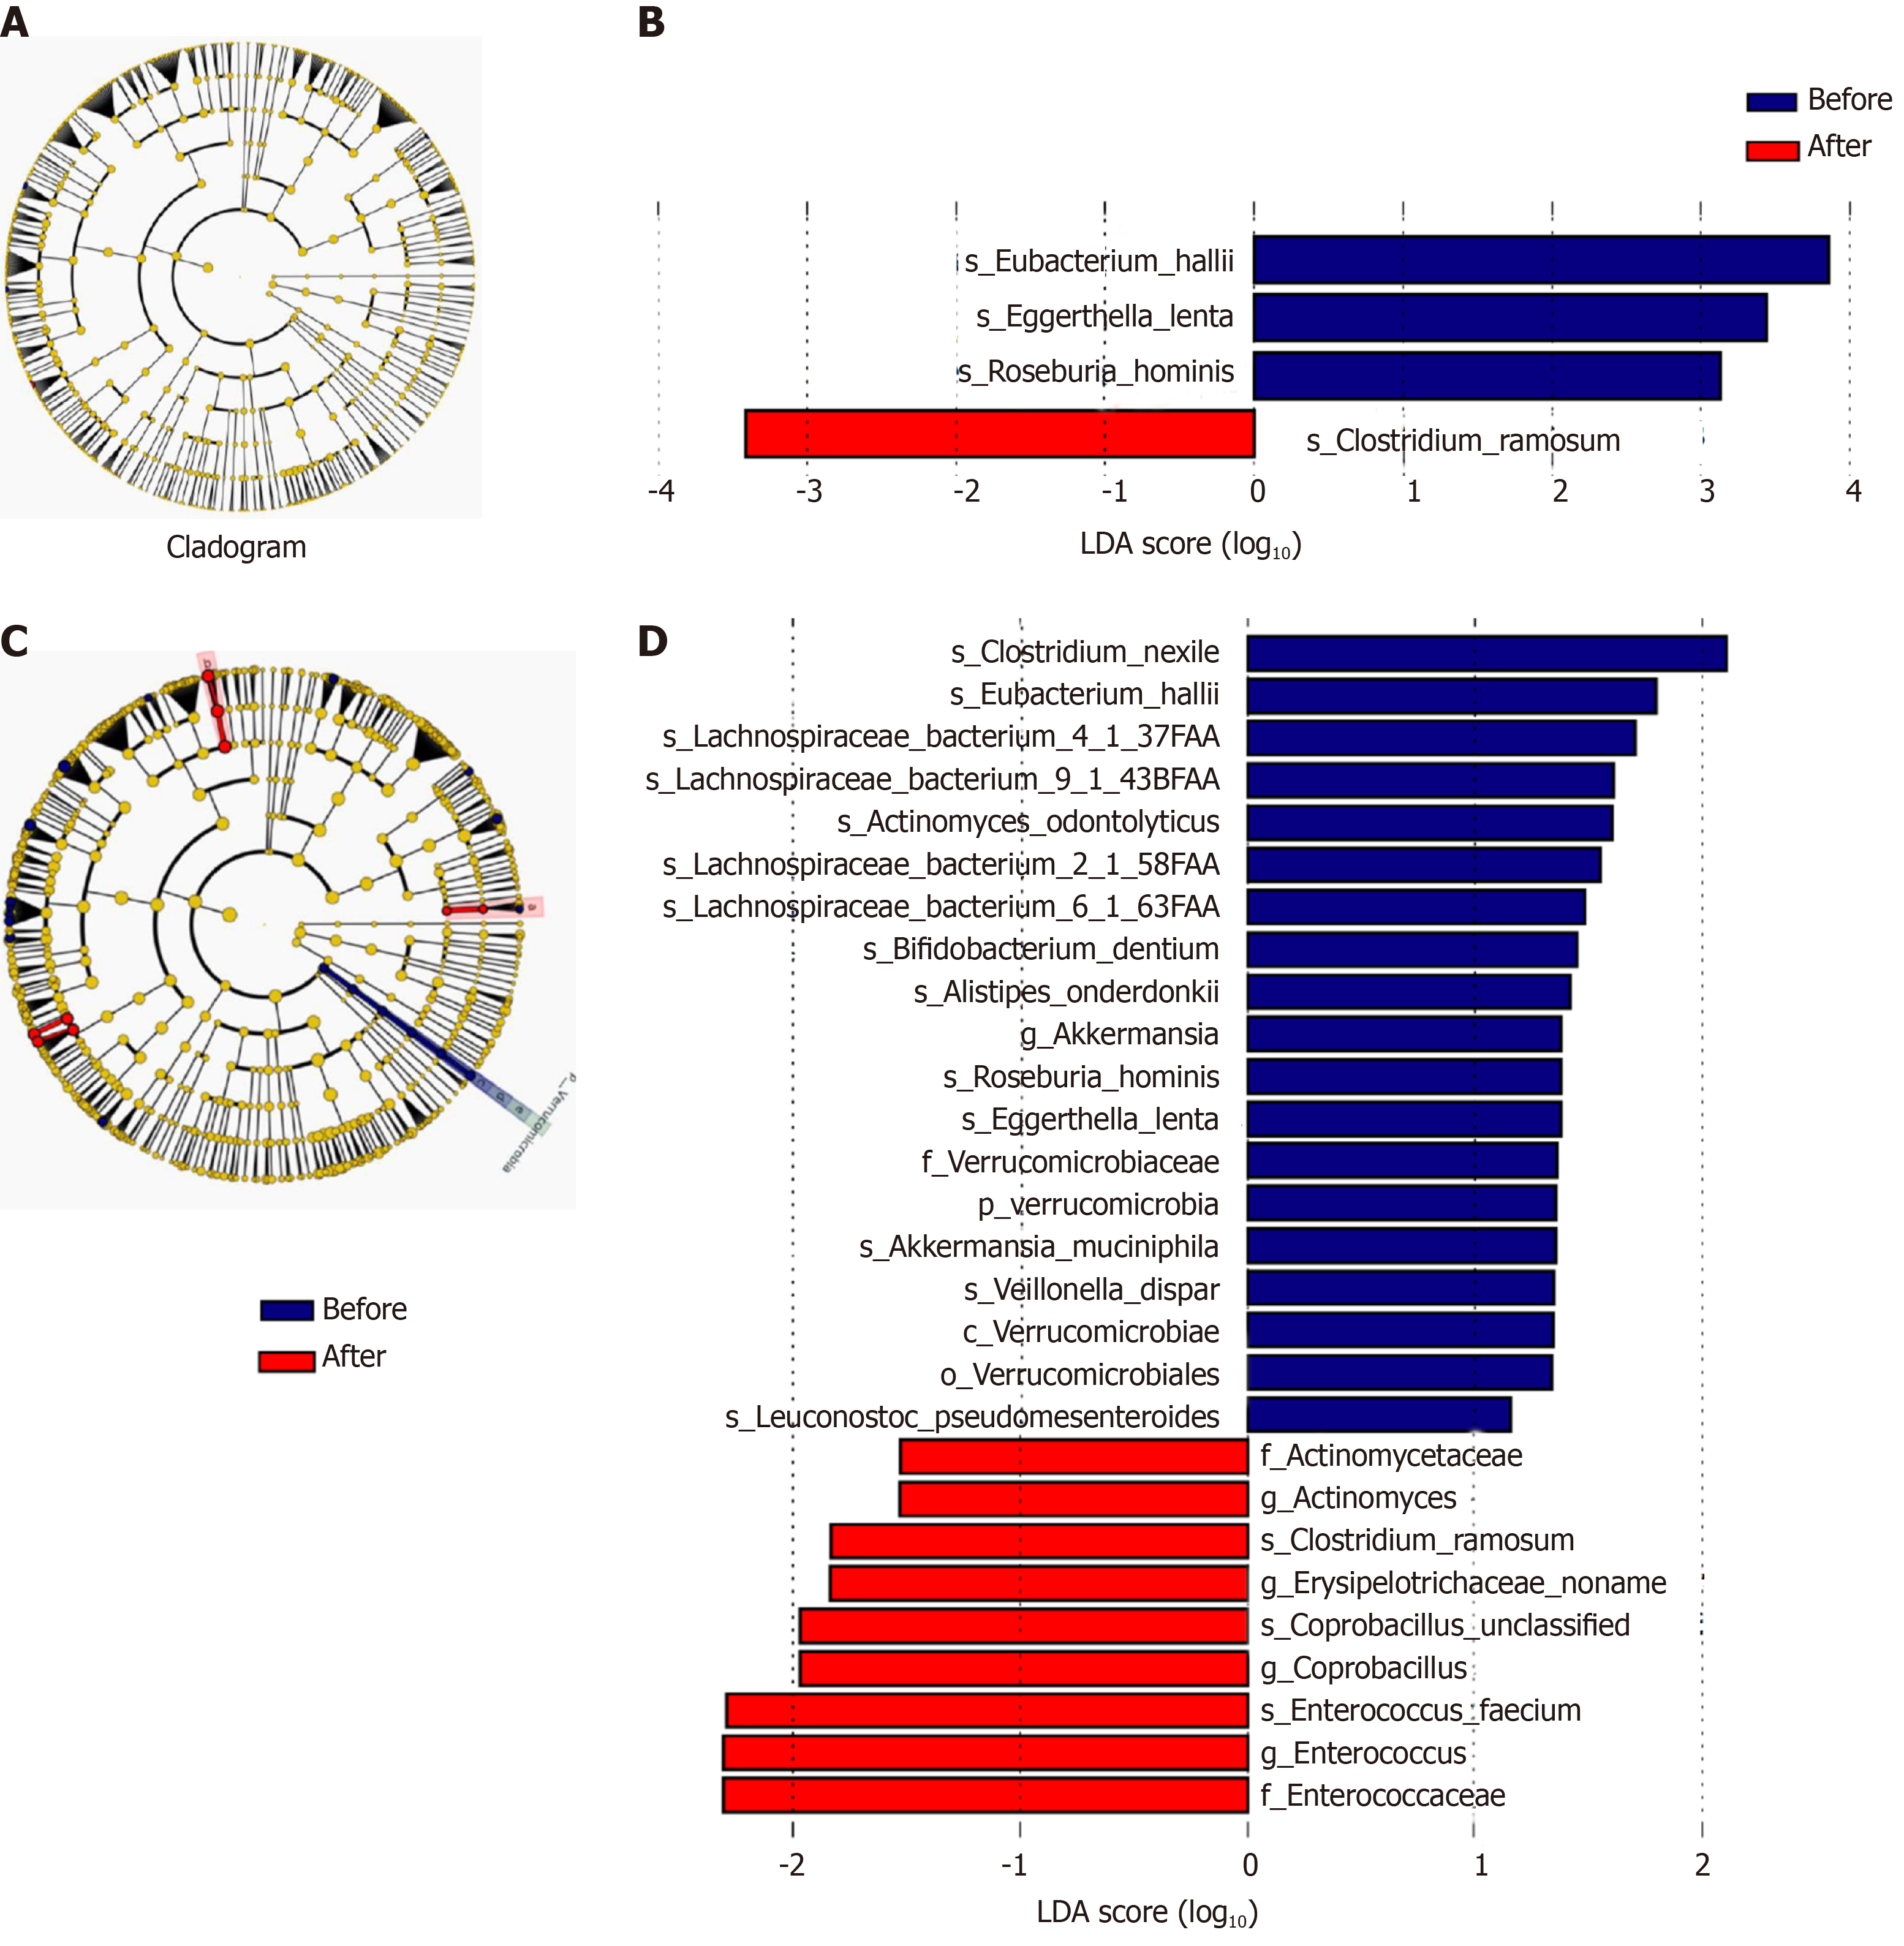
Figure 8 Cladogram and Linear discriminant analysis score of Lefse analysis of patients in the subgroup of rifaximin and rifaximin plus intravenous antibiotics.
A and B: Subgroup of rifaximin; C and D: Rifaximin plus intravenous antibiotics. The taxonomic levels are shown in the cladograms, represented by rings with kingdoms at the innermost ring and genera at the outermost ring, the small circles at each classification level represent different classifications at that level, and the diameters represent the relative abundance. Yellow represents no significant difference while blue and red represent significantly different microbiota before and after treatment, respectively. The Linear discriminant analysis score shows significant differences at > 2.0; red and blue represent before and after treatment, respectively, and the length represents the Linear discriminant analysis score, which is the degree of significant difference. LDA: Linear discriminant analysis.
- Citation: Lv XY, Ding HG, Zheng JF, Fan CL, Li L. Rifaximin improves survival in cirrhotic patients with refractory ascites: A real-world study. World J Gastroenterol 2020; 26(2): 199-218
- URL: https://www.wjgnet.com/1007-9327/full/v26/i2/199.htm
- DOI: https://dx.doi.org/10.3748/wjg.v26.i2.199


