
















©The Author(s) 2020.
World J Gastroenterol. Jan 14, 2020; 26(2): 109-133
Published online Jan 14, 2020. doi: 10.3748/wjg.v26.i2.109
Published online Jan 14, 2020. doi: 10.3748/wjg.v26.i2.109
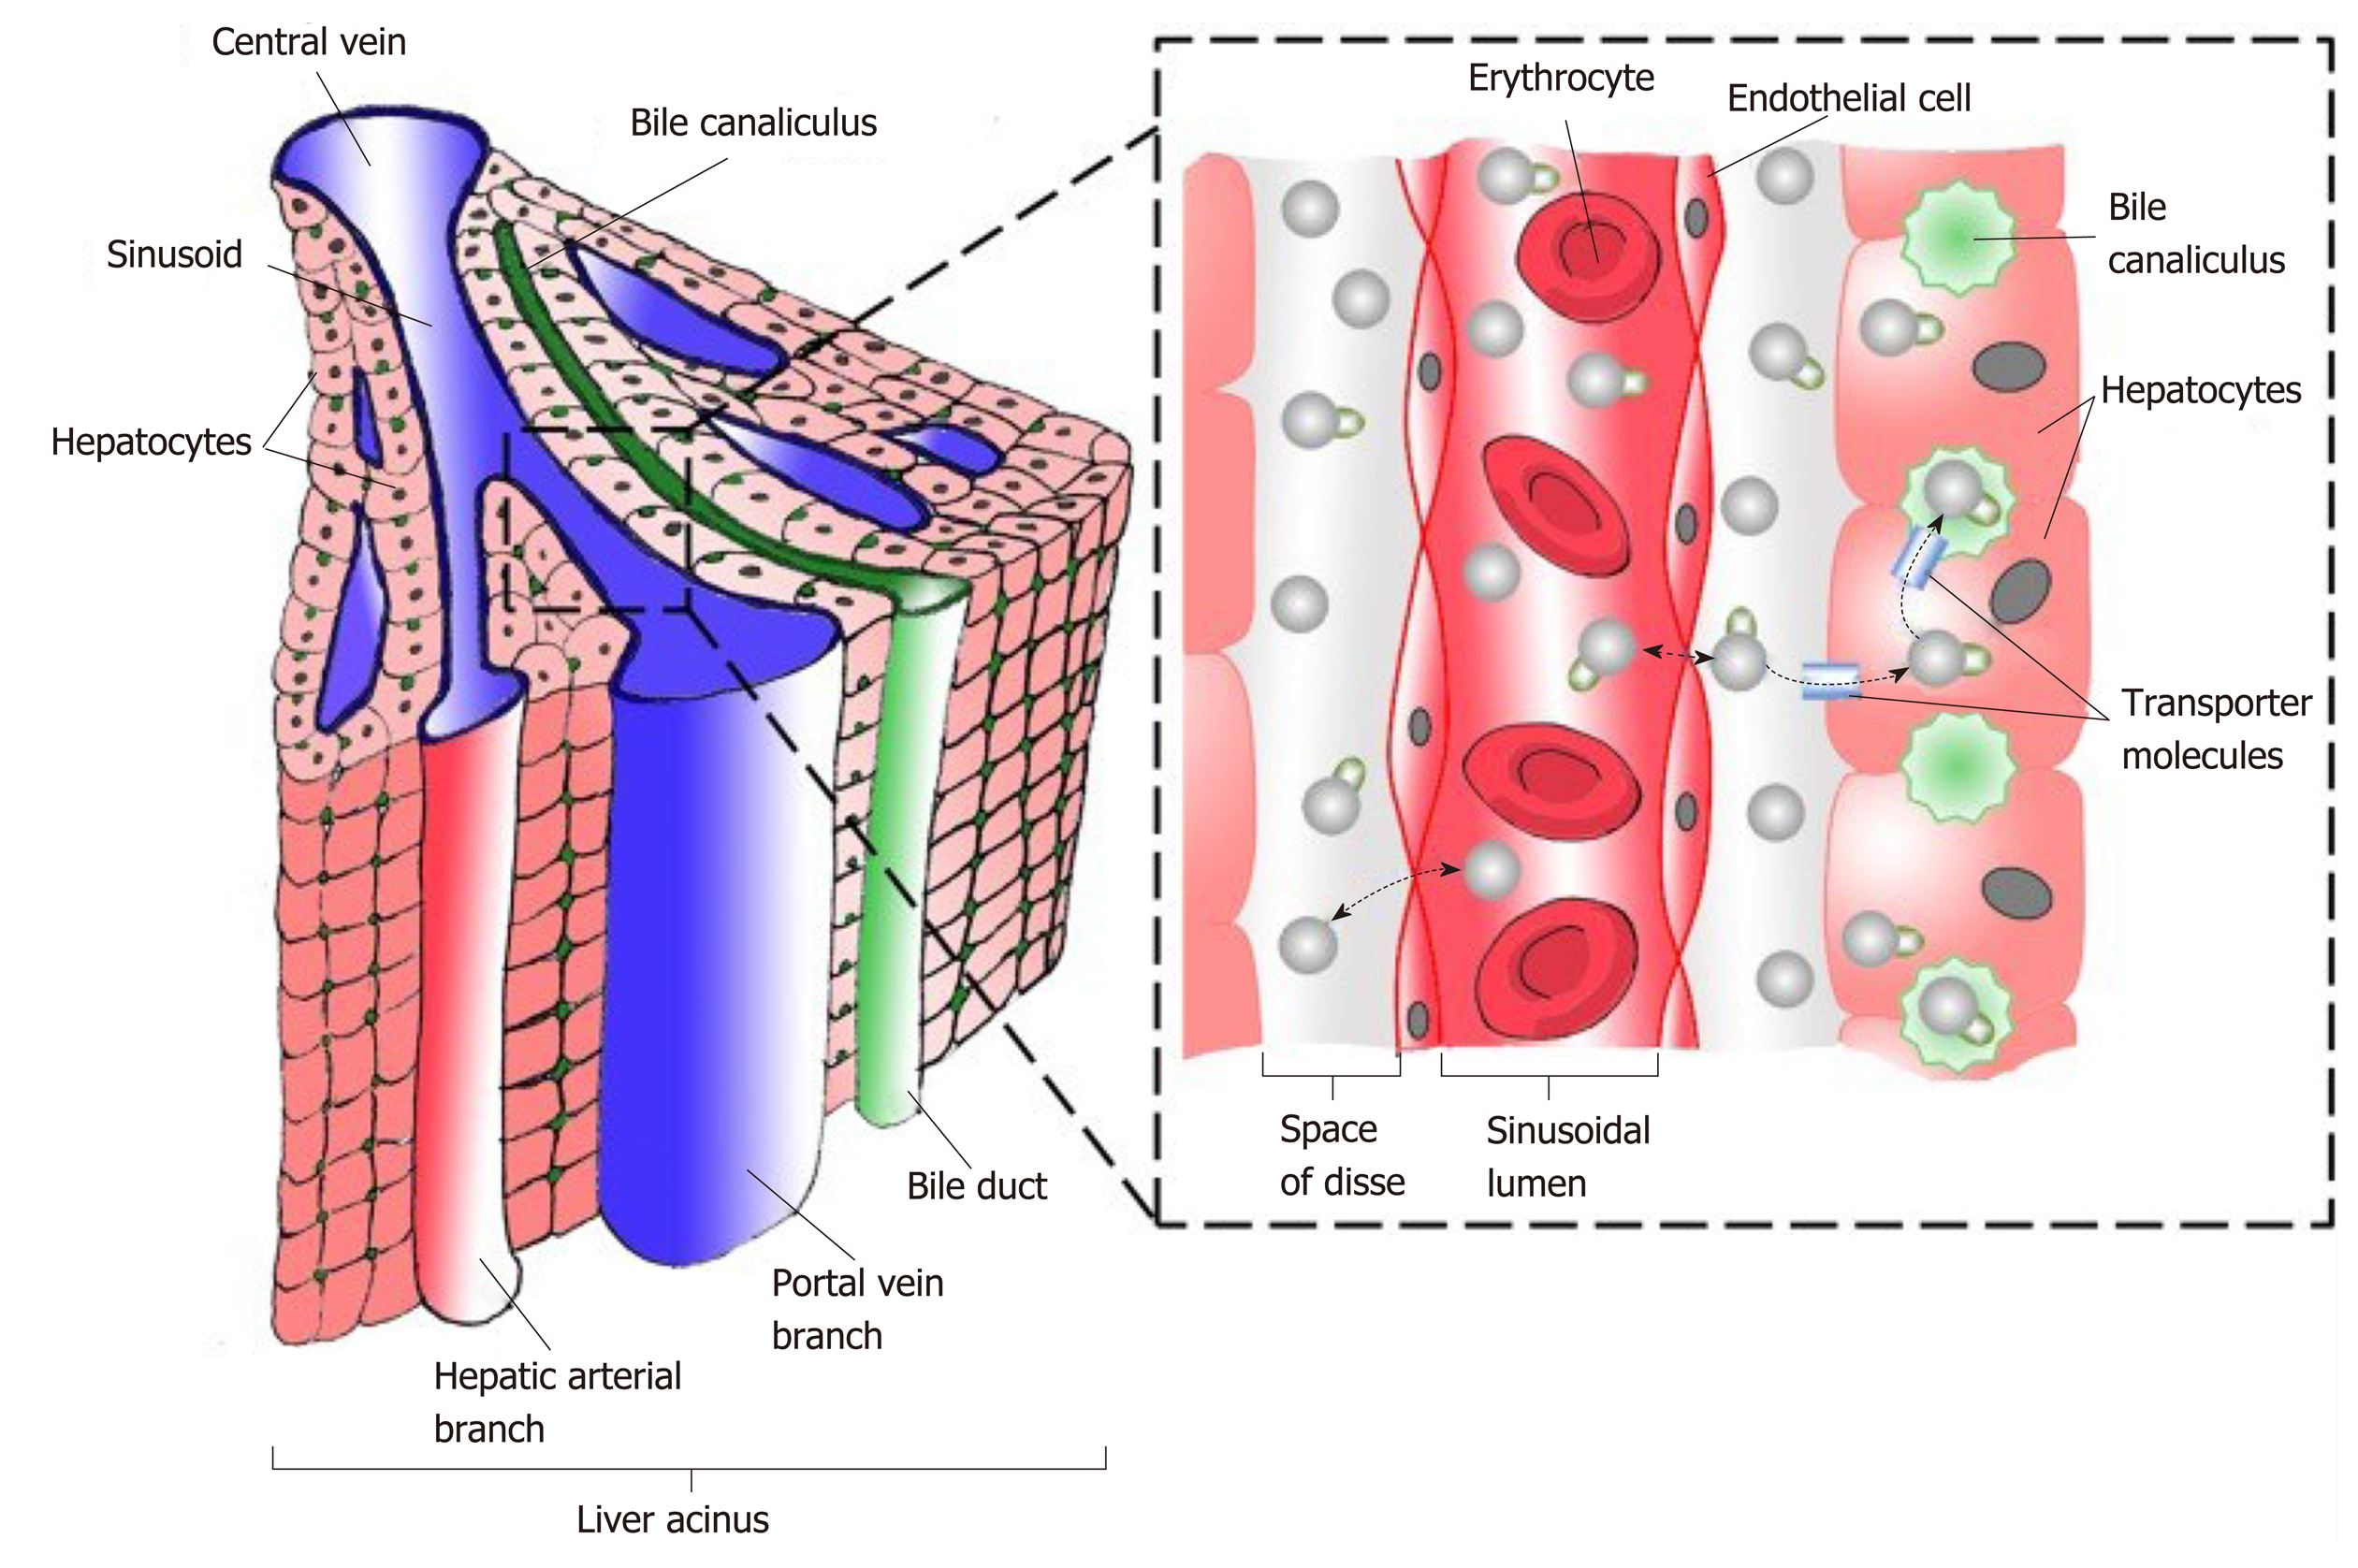
Figure 3 Schematic diagram representing functional hepatic acinus with hepatic venules (blue), hepatic arteriole (red), bile ductules (green) together with the relationship to the Space of Disse and the sinusoidal lumen.
Reproduced with permission of Creative Commons Attribution License from Chouhan et al[166].
- Citation: Tanwar S, Rhodes F, Srivastava A, Trembling PM, Rosenberg WM. Inflammation and fibrosis in chronic liver diseases including non-alcoholic fatty liver disease and hepatitis C. World J Gastroenterol 2020; 26(2): 109-133
- URL: https://www.wjgnet.com/1007-9327/full/v26/i2/109.htm
- DOI: https://dx.doi.org/10.3748/wjg.v26.i2.109