Copyright
©The Author(s) 2020.
World J Gastroenterol. May 21, 2020; 26(19): 2388-2402
Published online May 21, 2020. doi: 10.3748/wjg.v26.i19.2388
Published online May 21, 2020. doi: 10.3748/wjg.v26.i19.2388
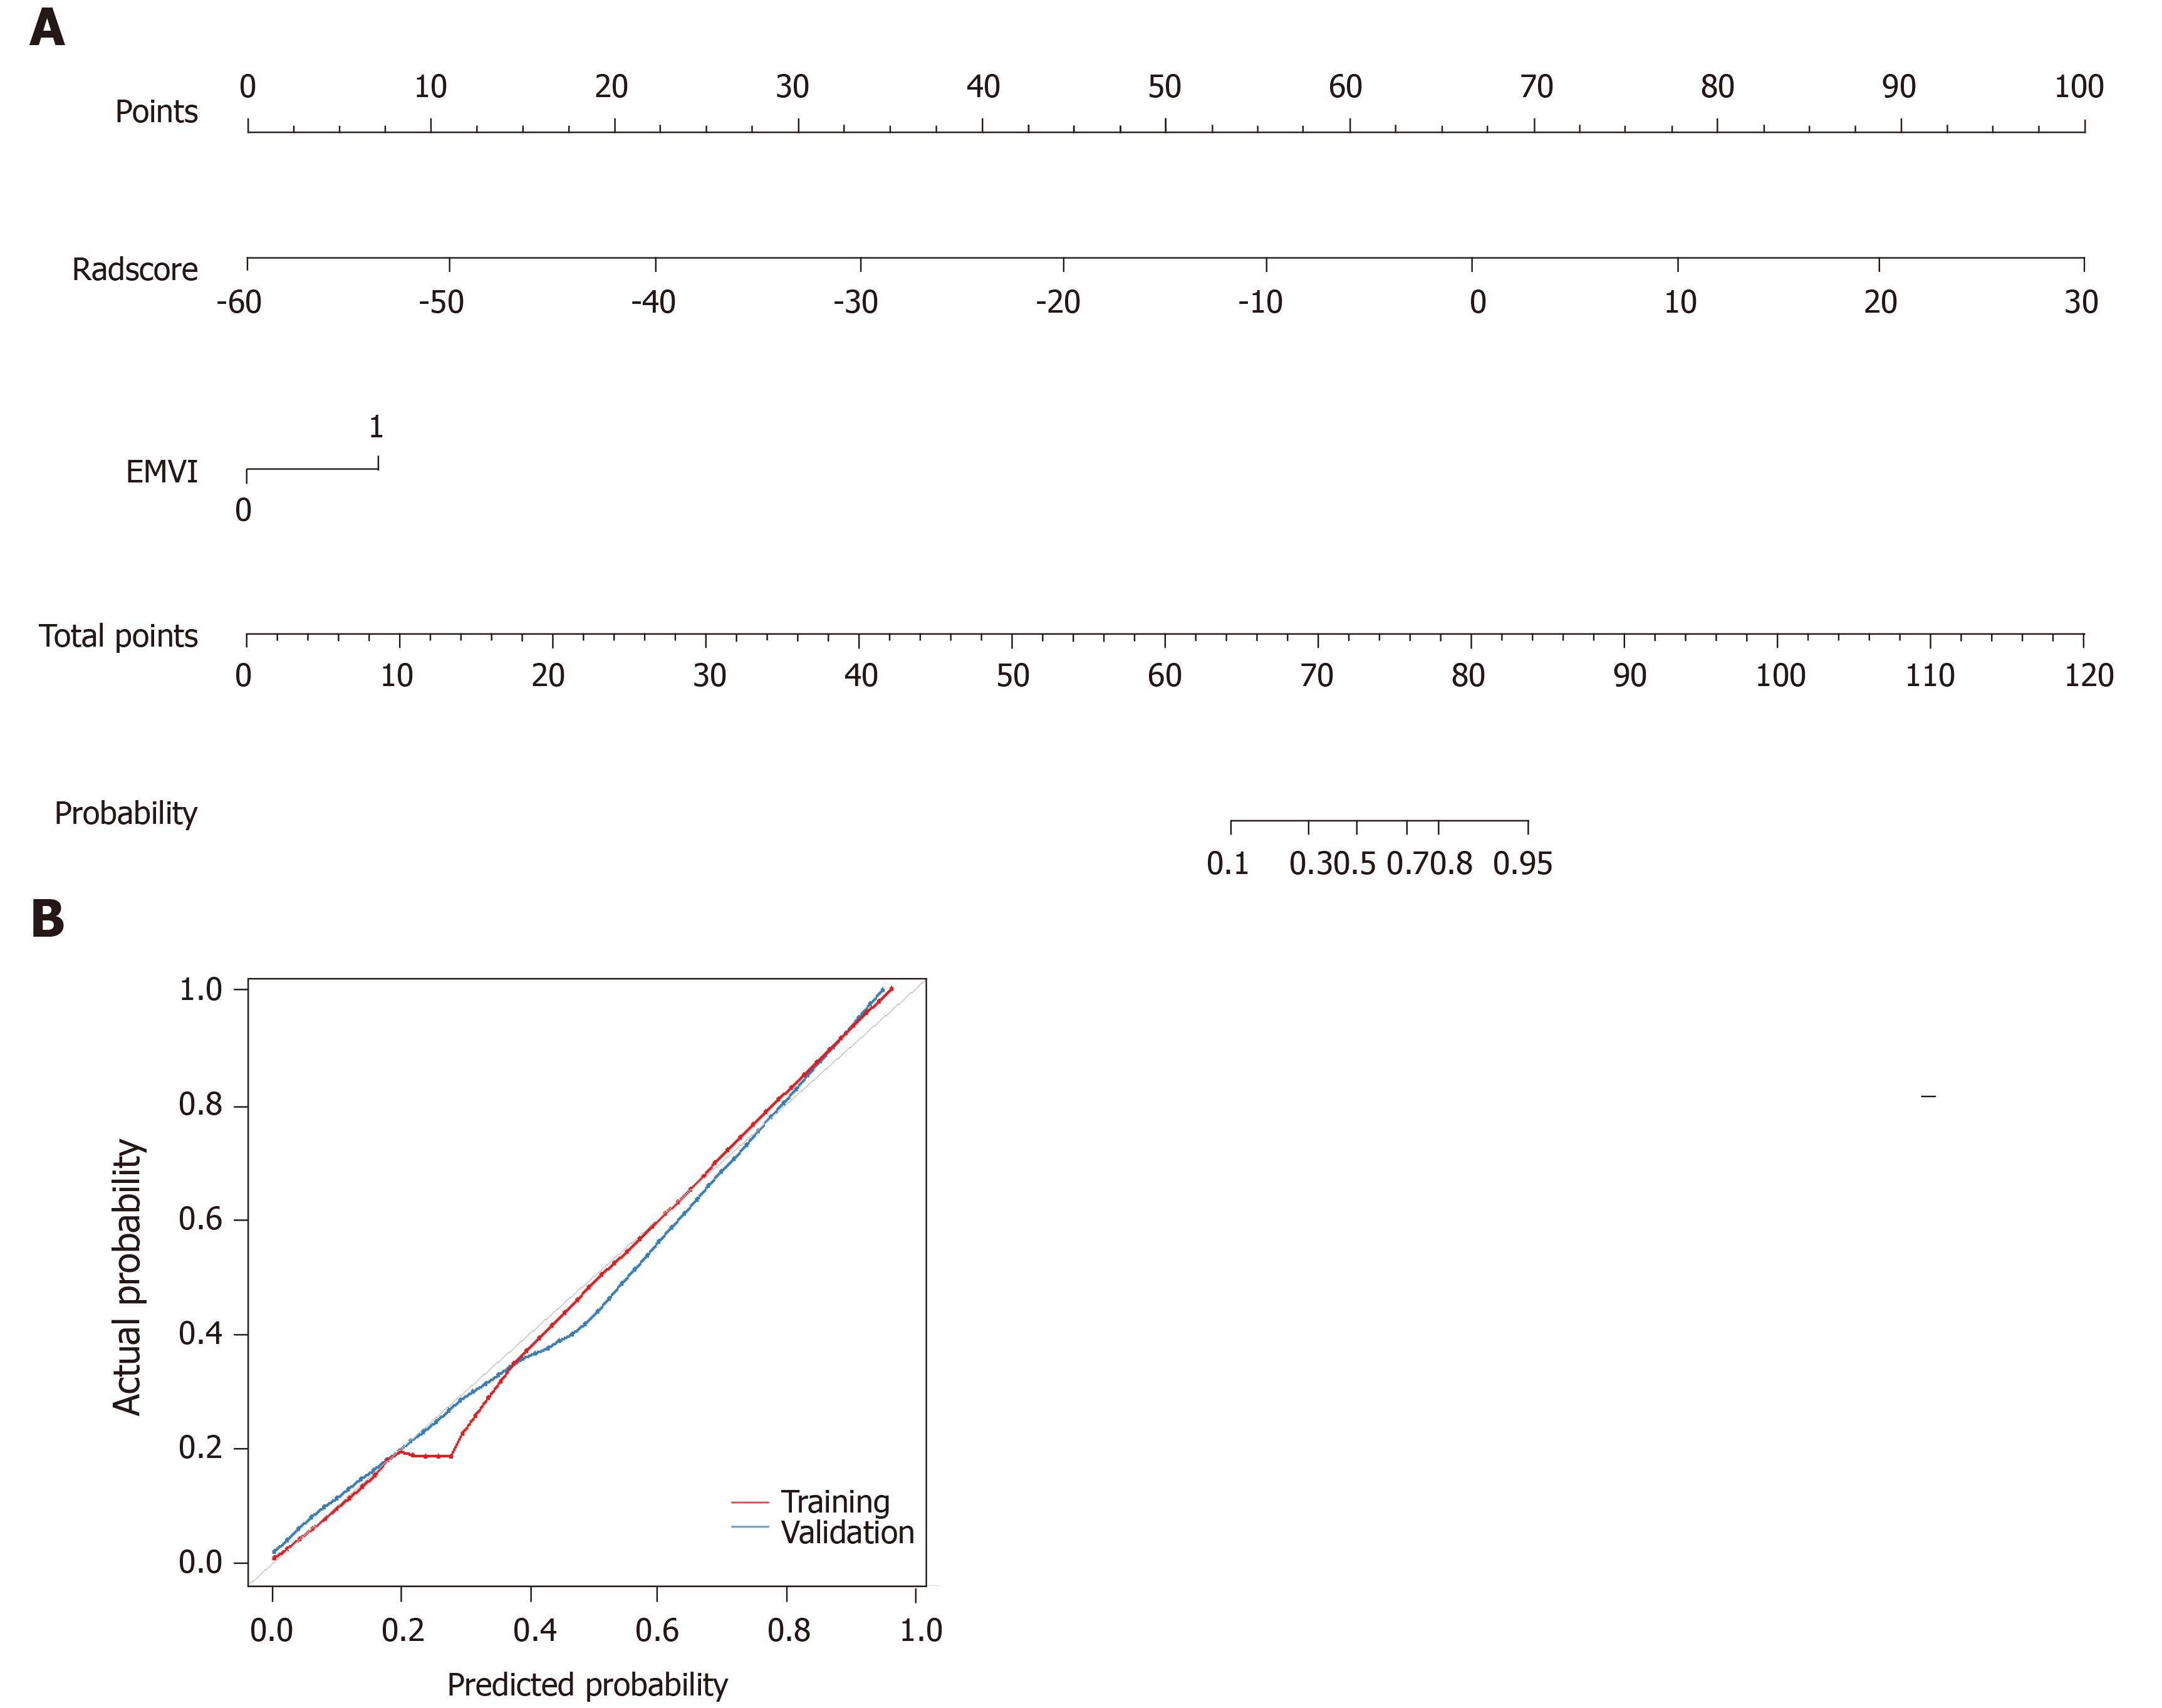
Figure 5 Development of predictive nomograms.
A: From each variable location on the corresponding axis, a line was drawn straight upward to the point axis and a point was obtained. After adding up all points, a line from the total points axis was drawn to the bottom line to determine the probability of response to neoadjuvant chemotherapy; B: Calibration curves for the radiomics nomogram in the training and validation cohort. The actual outcome of response to neoadjuvant chemotherapy is represented on the y-axis, and the predicted probability is represented on the x-axis. The closer the fit of the diagonal red and blue lines to the ideal grey line indicates the predictive accuracy of the nomogram. EMVI: Extramural venous invasion.
- Citation: Li ZY, Wang XD, Li M, Liu XJ, Ye Z, Song B, Yuan F, Yuan Y, Xia CC, Zhang X, Li Q. Multi-modal radiomics model to predict treatment response to neoadjuvant chemotherapy for locally advanced rectal cancer. World J Gastroenterol 2020; 26(19): 2388-2402
- URL: https://www.wjgnet.com/1007-9327/full/v26/i19/2388.htm
- DOI: https://dx.doi.org/10.3748/wjg.v26.i19.2388


