Copyright
©The Author(s) 2020.
World J Gastroenterol. May 21, 2020; 26(19): 2374-2387
Published online May 21, 2020. doi: 10.3748/wjg.v26.i19.2374
Published online May 21, 2020. doi: 10.3748/wjg.v26.i19.2374
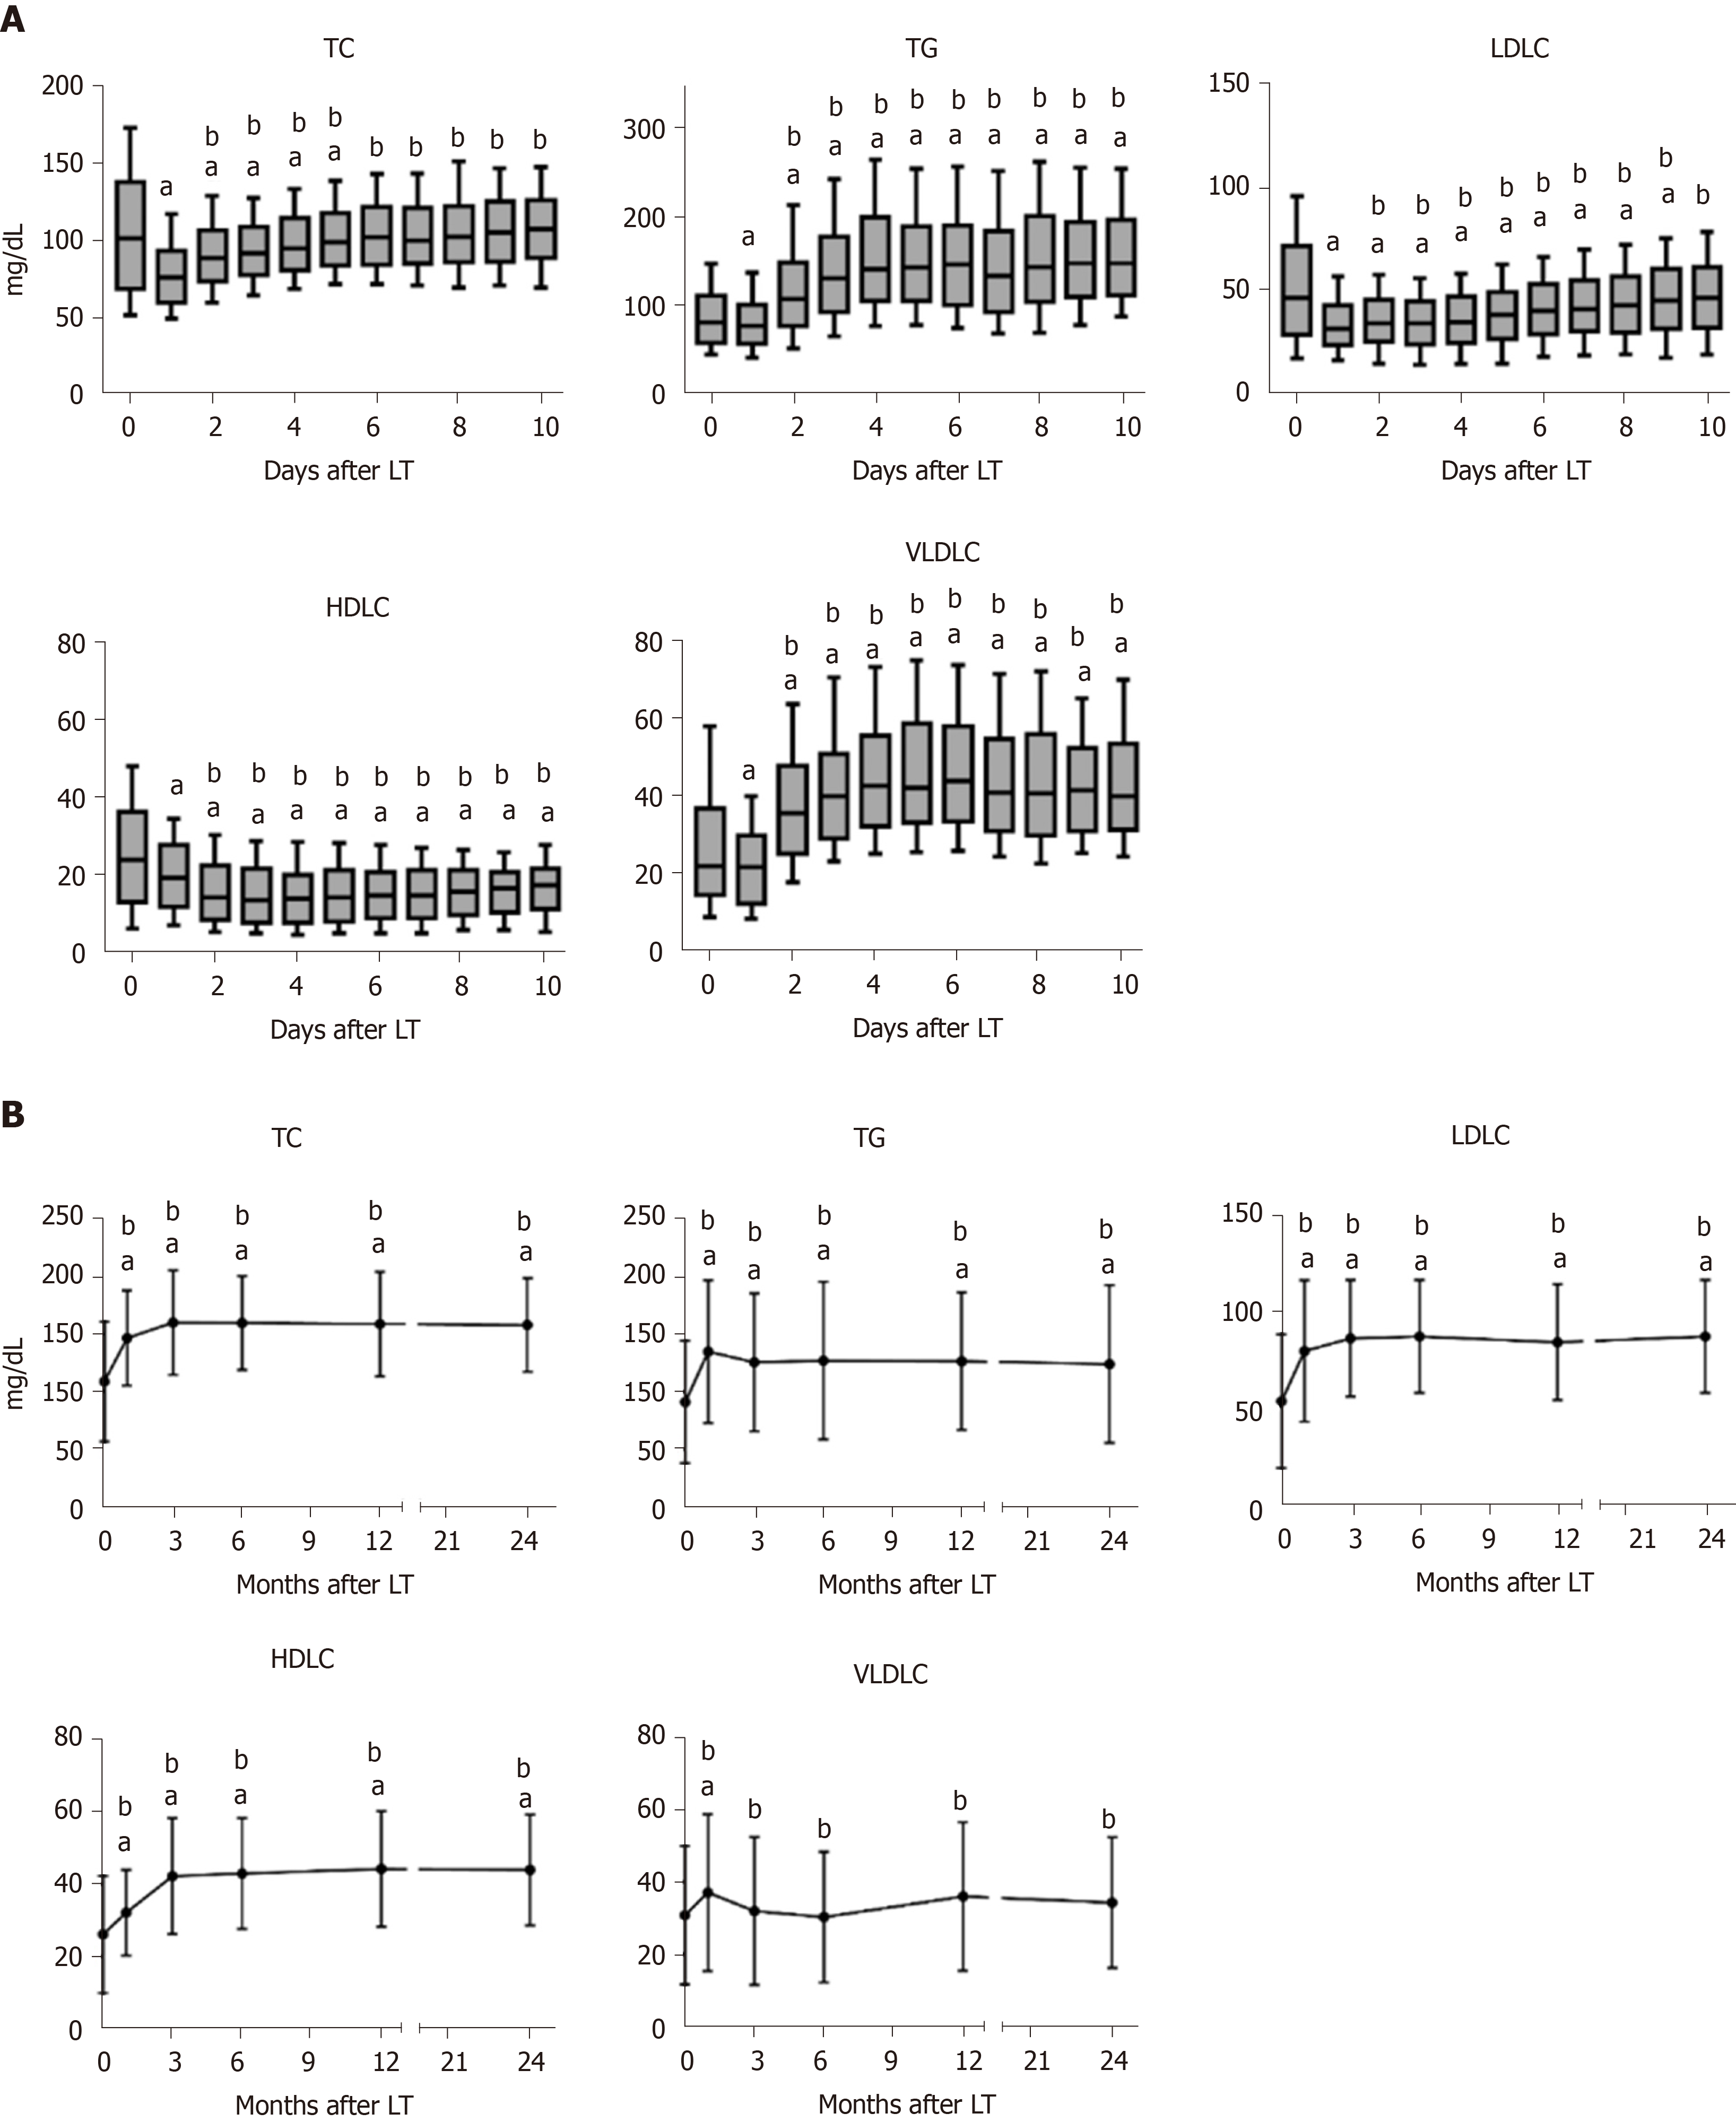
Figure 1 Dynamic process of lipid profile after liver transplantation.
A: Dynamic changes of total cholesterol, triglyceride, high-density lipoprotein cholesterol, low-density lipoprotein cholesterol, and very low-density lipoprotein cholesterol during 10 d after liver transplantation; B: Dynamic changes of total cholesterol, triglyceride, high-density lipoprotein cholesterol, low-density lipoprotein cholesterol, and very low-density lipoprotein cholesterol during 24 mo after liver transplantation. Data are expressed as the mean ± SD or median (10-90 percentiles). aP < 0.05 vs pre-transplant; bP < 0.05 vs day 1. TC: Total cholesterol; TG: Triglyceride; HDLC: High-density lipoprotein cholesterol; LDLC: Low-density lipoprotein cholesterol; VLDLC: Very low-density lipoprotein cholesterol; LT: Liver transplantation.
- Citation: Huang HT, Zhang XY, Zhang C, Ling Q, Zheng SS. Predicting dyslipidemia after liver transplantation: A significant role of recipient metabolic inflammation profile. World J Gastroenterol 2020; 26(19): 2374-2387
- URL: https://www.wjgnet.com/1007-9327/full/v26/i19/2374.htm
- DOI: https://dx.doi.org/10.3748/wjg.v26.i19.2374


