Copyright
©The Author(s) 2020.
World J Gastroenterol. May 14, 2020; 26(18): 2247-2267
Published online May 14, 2020. doi: 10.3748/wjg.v26.i18.2247
Published online May 14, 2020. doi: 10.3748/wjg.v26.i18.2247
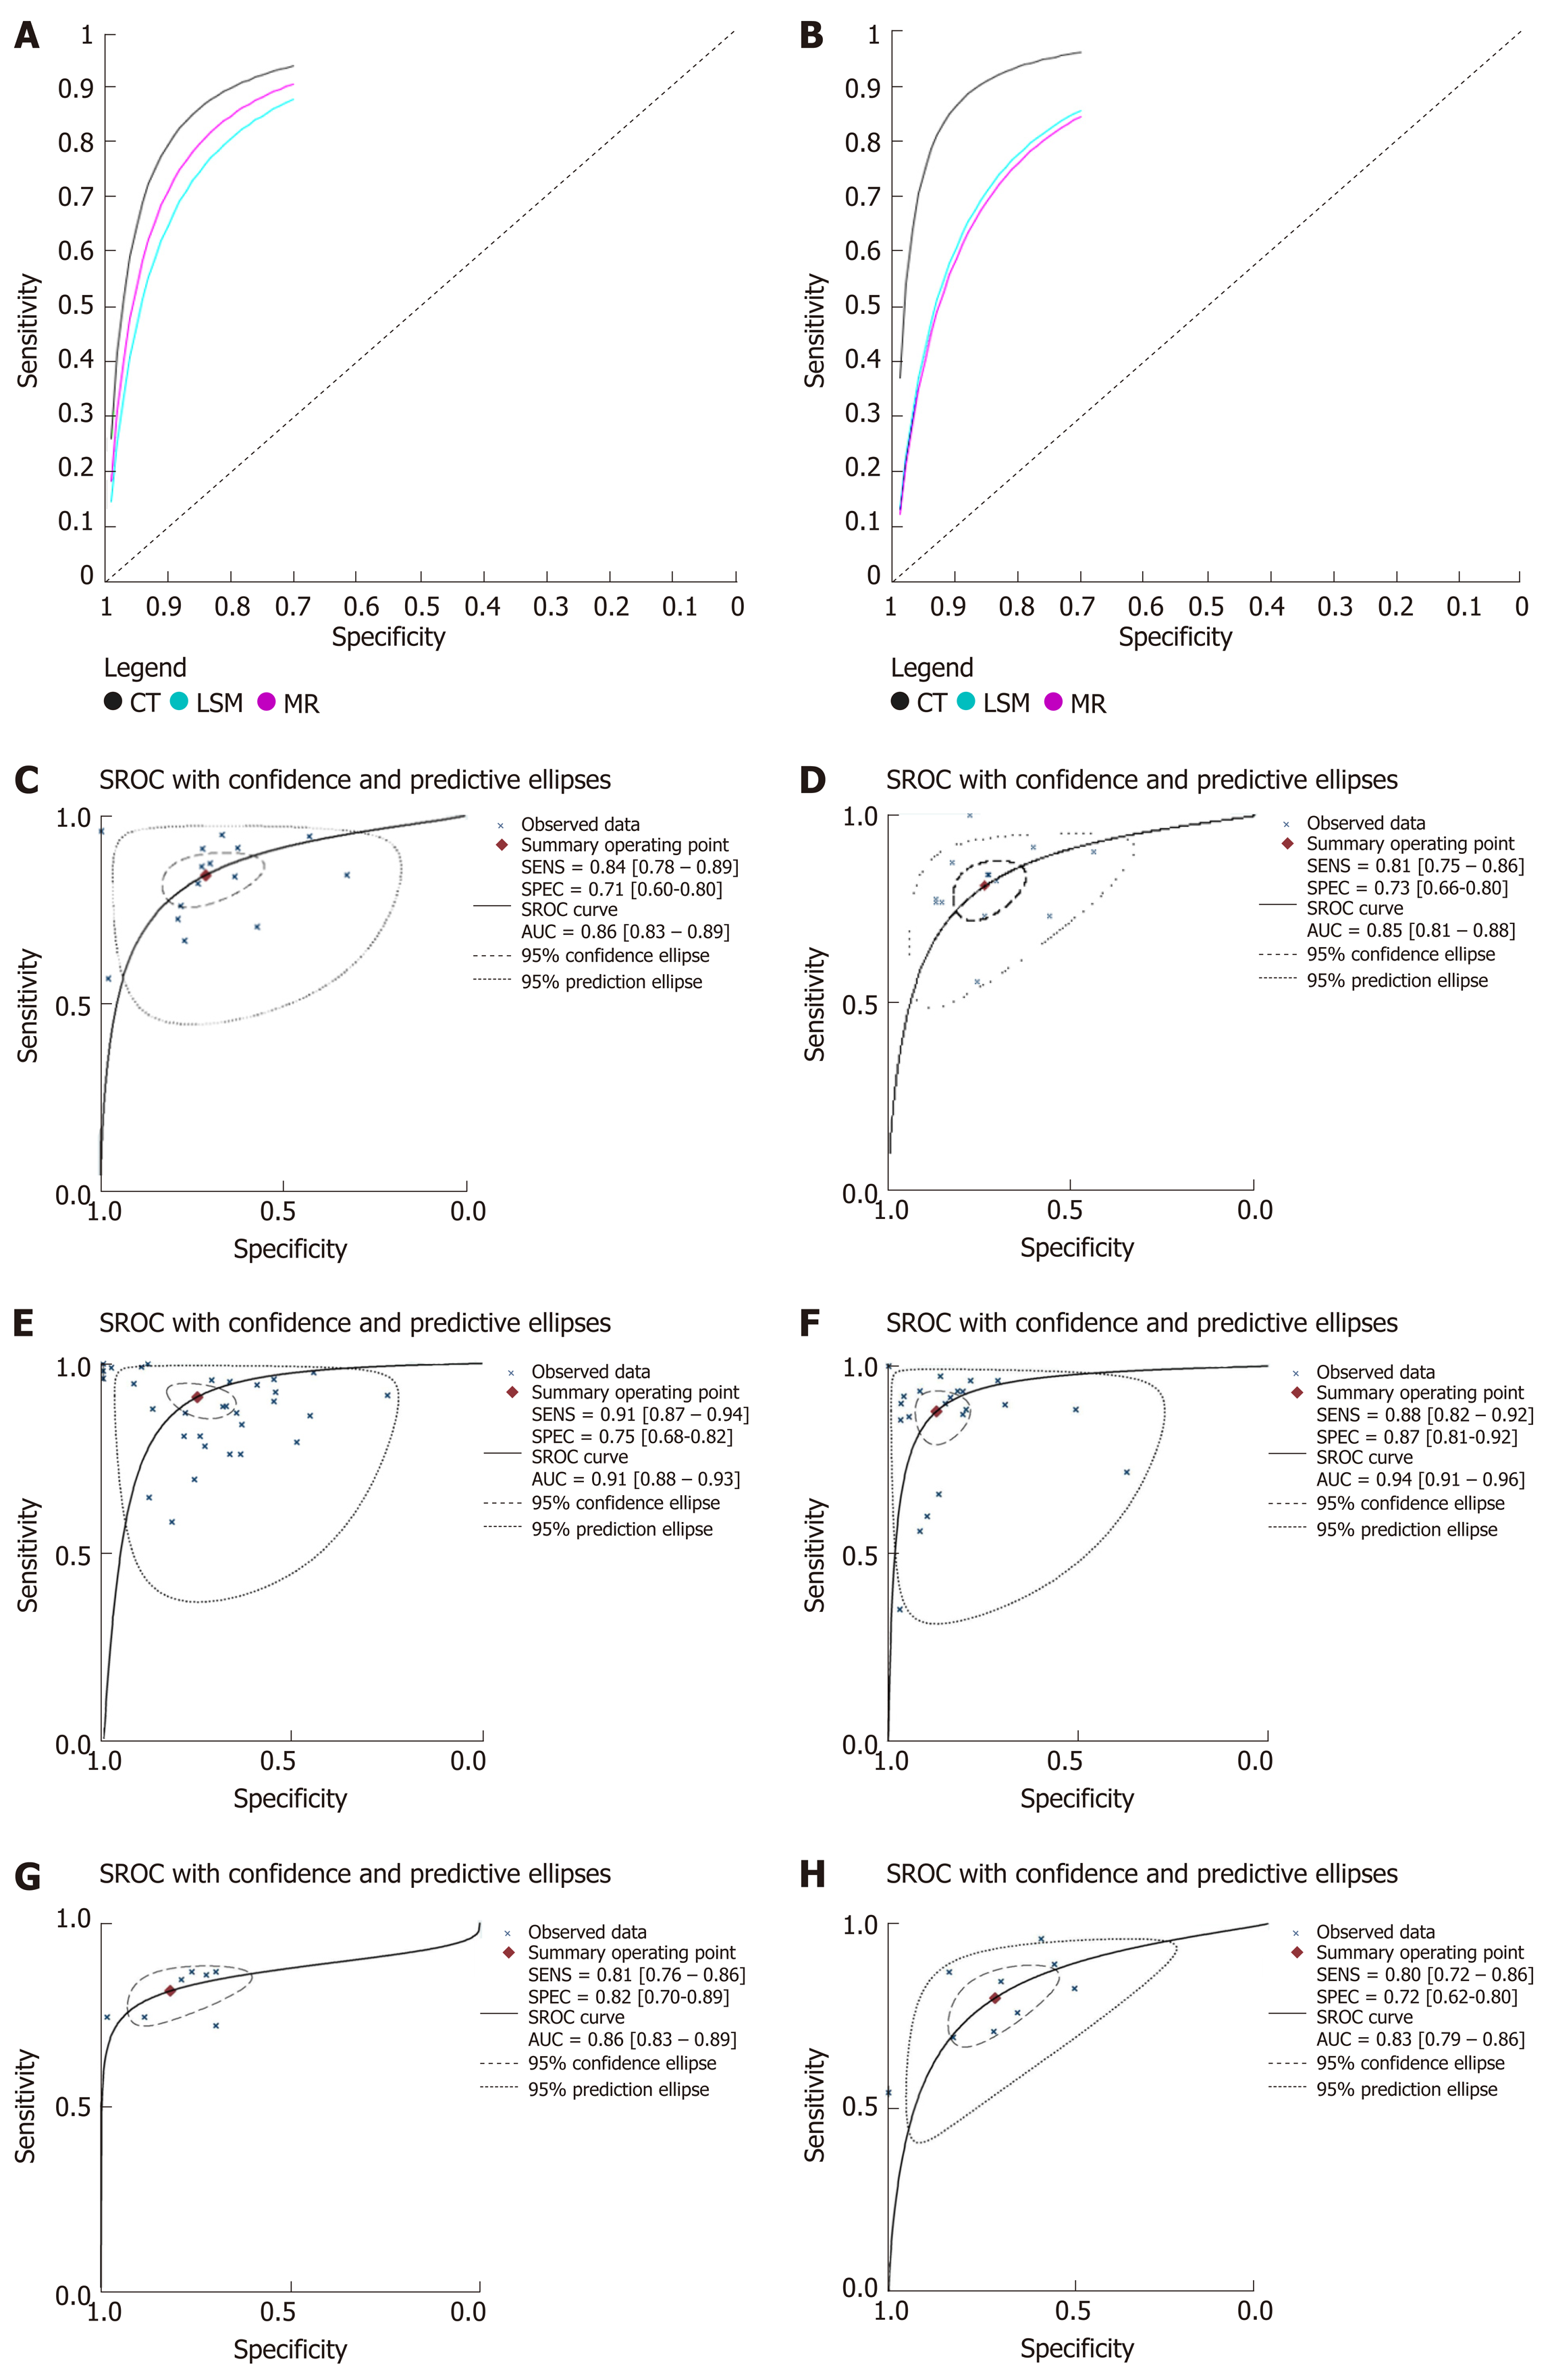
Figure 3 Summary receiver operating characteristic curves.
A and B: Summary receiver operating characteristic (SROC) curves of liver stiffness measurement, computed tomography, and magnetic resonance imaging for the diagnosis of esophageal varices (EV) and prediction of high-bleeding-risk EV (HREV); C and D: SROC curves of liver stiffness measurement for the diagnosis of EV and prediction of HREV; E and F: SROC curves of computed tomography for the diagnosis of EV and prediction of HREV; G and H: SROC curves of magnetic resonance imaging for the diagnosis of EV and prediction of HREV.
- Citation: Li Y, Li L, Weng HL, Liebe R, Ding HG. Computed tomography vs liver stiffness measurement and magnetic resonance imaging in evaluating esophageal varices in cirrhotic patients: A systematic review and meta-analysis. World J Gastroenterol 2020; 26(18): 2247-2267
- URL: https://www.wjgnet.com/1007-9327/full/v26/i18/2247.htm
- DOI: https://dx.doi.org/10.3748/wjg.v26.i18.2247


