Copyright
©The Author(s) 2020.
World J Gastroenterol. Apr 21, 2020; 26(15): 1805-1819
Published online Apr 21, 2020. doi: 10.3748/wjg.v26.i15.1805
Published online Apr 21, 2020. doi: 10.3748/wjg.v26.i15.1805
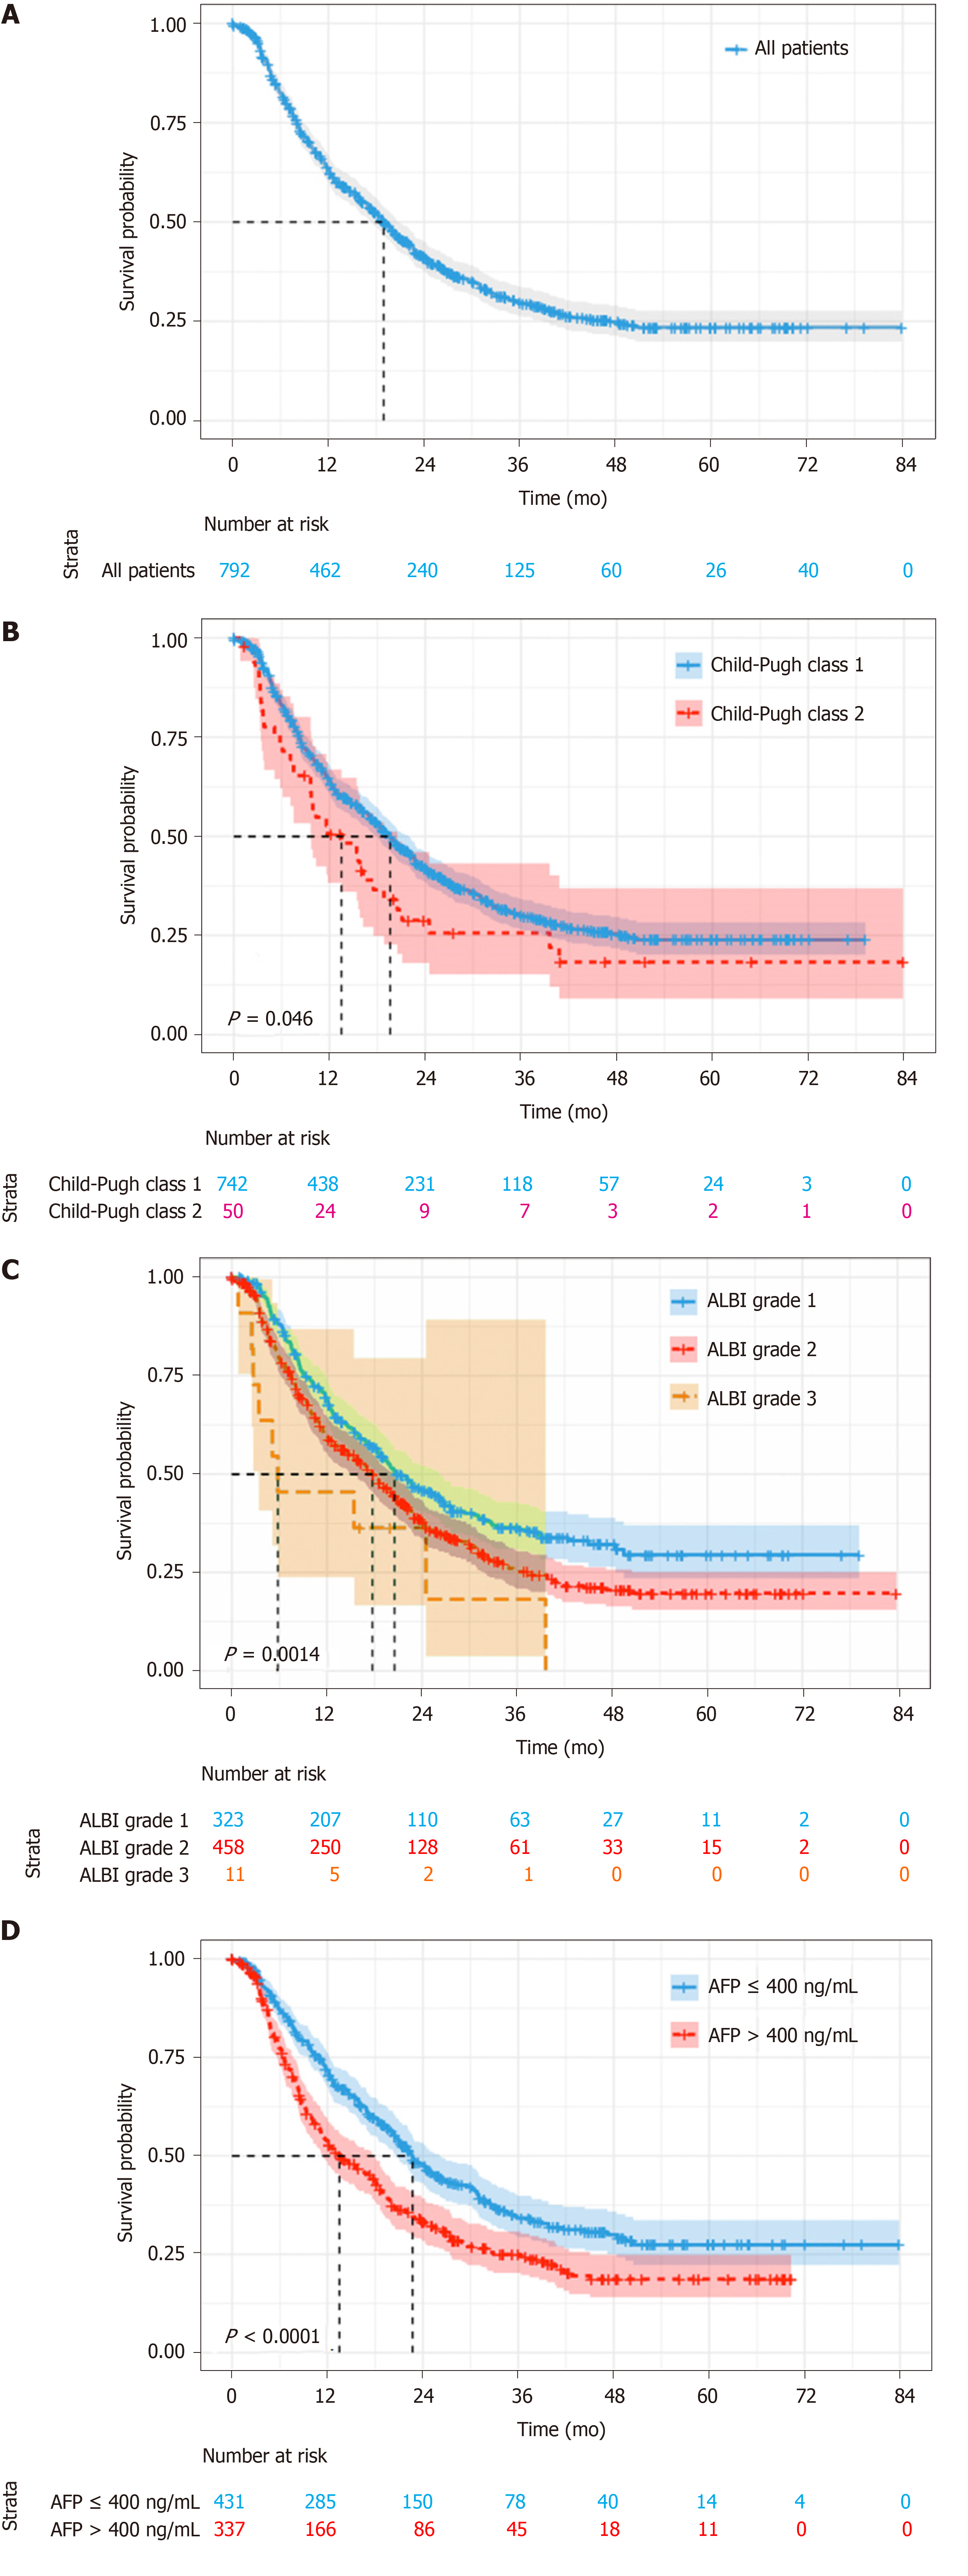
Figure 2 Kaplan–Meier curves for survival analysis and comparisons.
A: Survival analysis of the whole cohort; B: Comparisons among patients with different Child-Pugh class; C: Comparisons among patients with different albumin-bilirubin grade; D: Comparisons among patients with different alpha-fetoprotein level. ALBI: Albumin-bilirubin; AFP: Alpha-fetoprotein.
- Citation: Wang ZX, Li J, Wang EX, Xia DD, Bai W, Wang QH, Yuan J, Li XM, Niu J, Yin ZX, Xia JL, Fan DM, Han GH. Validation of the six-and-twelve criteria among patients with hepatocellular carcinoma and performance score 1 receiving transarterial chemoembolization. World J Gastroenterol 2020; 26(15): 1805-1819
- URL: https://www.wjgnet.com/1007-9327/full/v26/i15/1805.htm
- DOI: https://dx.doi.org/10.3748/wjg.v26.i15.1805


