Copyright
©The Author(s) 2019.
World J Gastroenterol. Mar 7, 2019; 25(9): 1067-1079
Published online Mar 7, 2019. doi: 10.3748/wjg.v25.i9.1067
Published online Mar 7, 2019. doi: 10.3748/wjg.v25.i9.1067
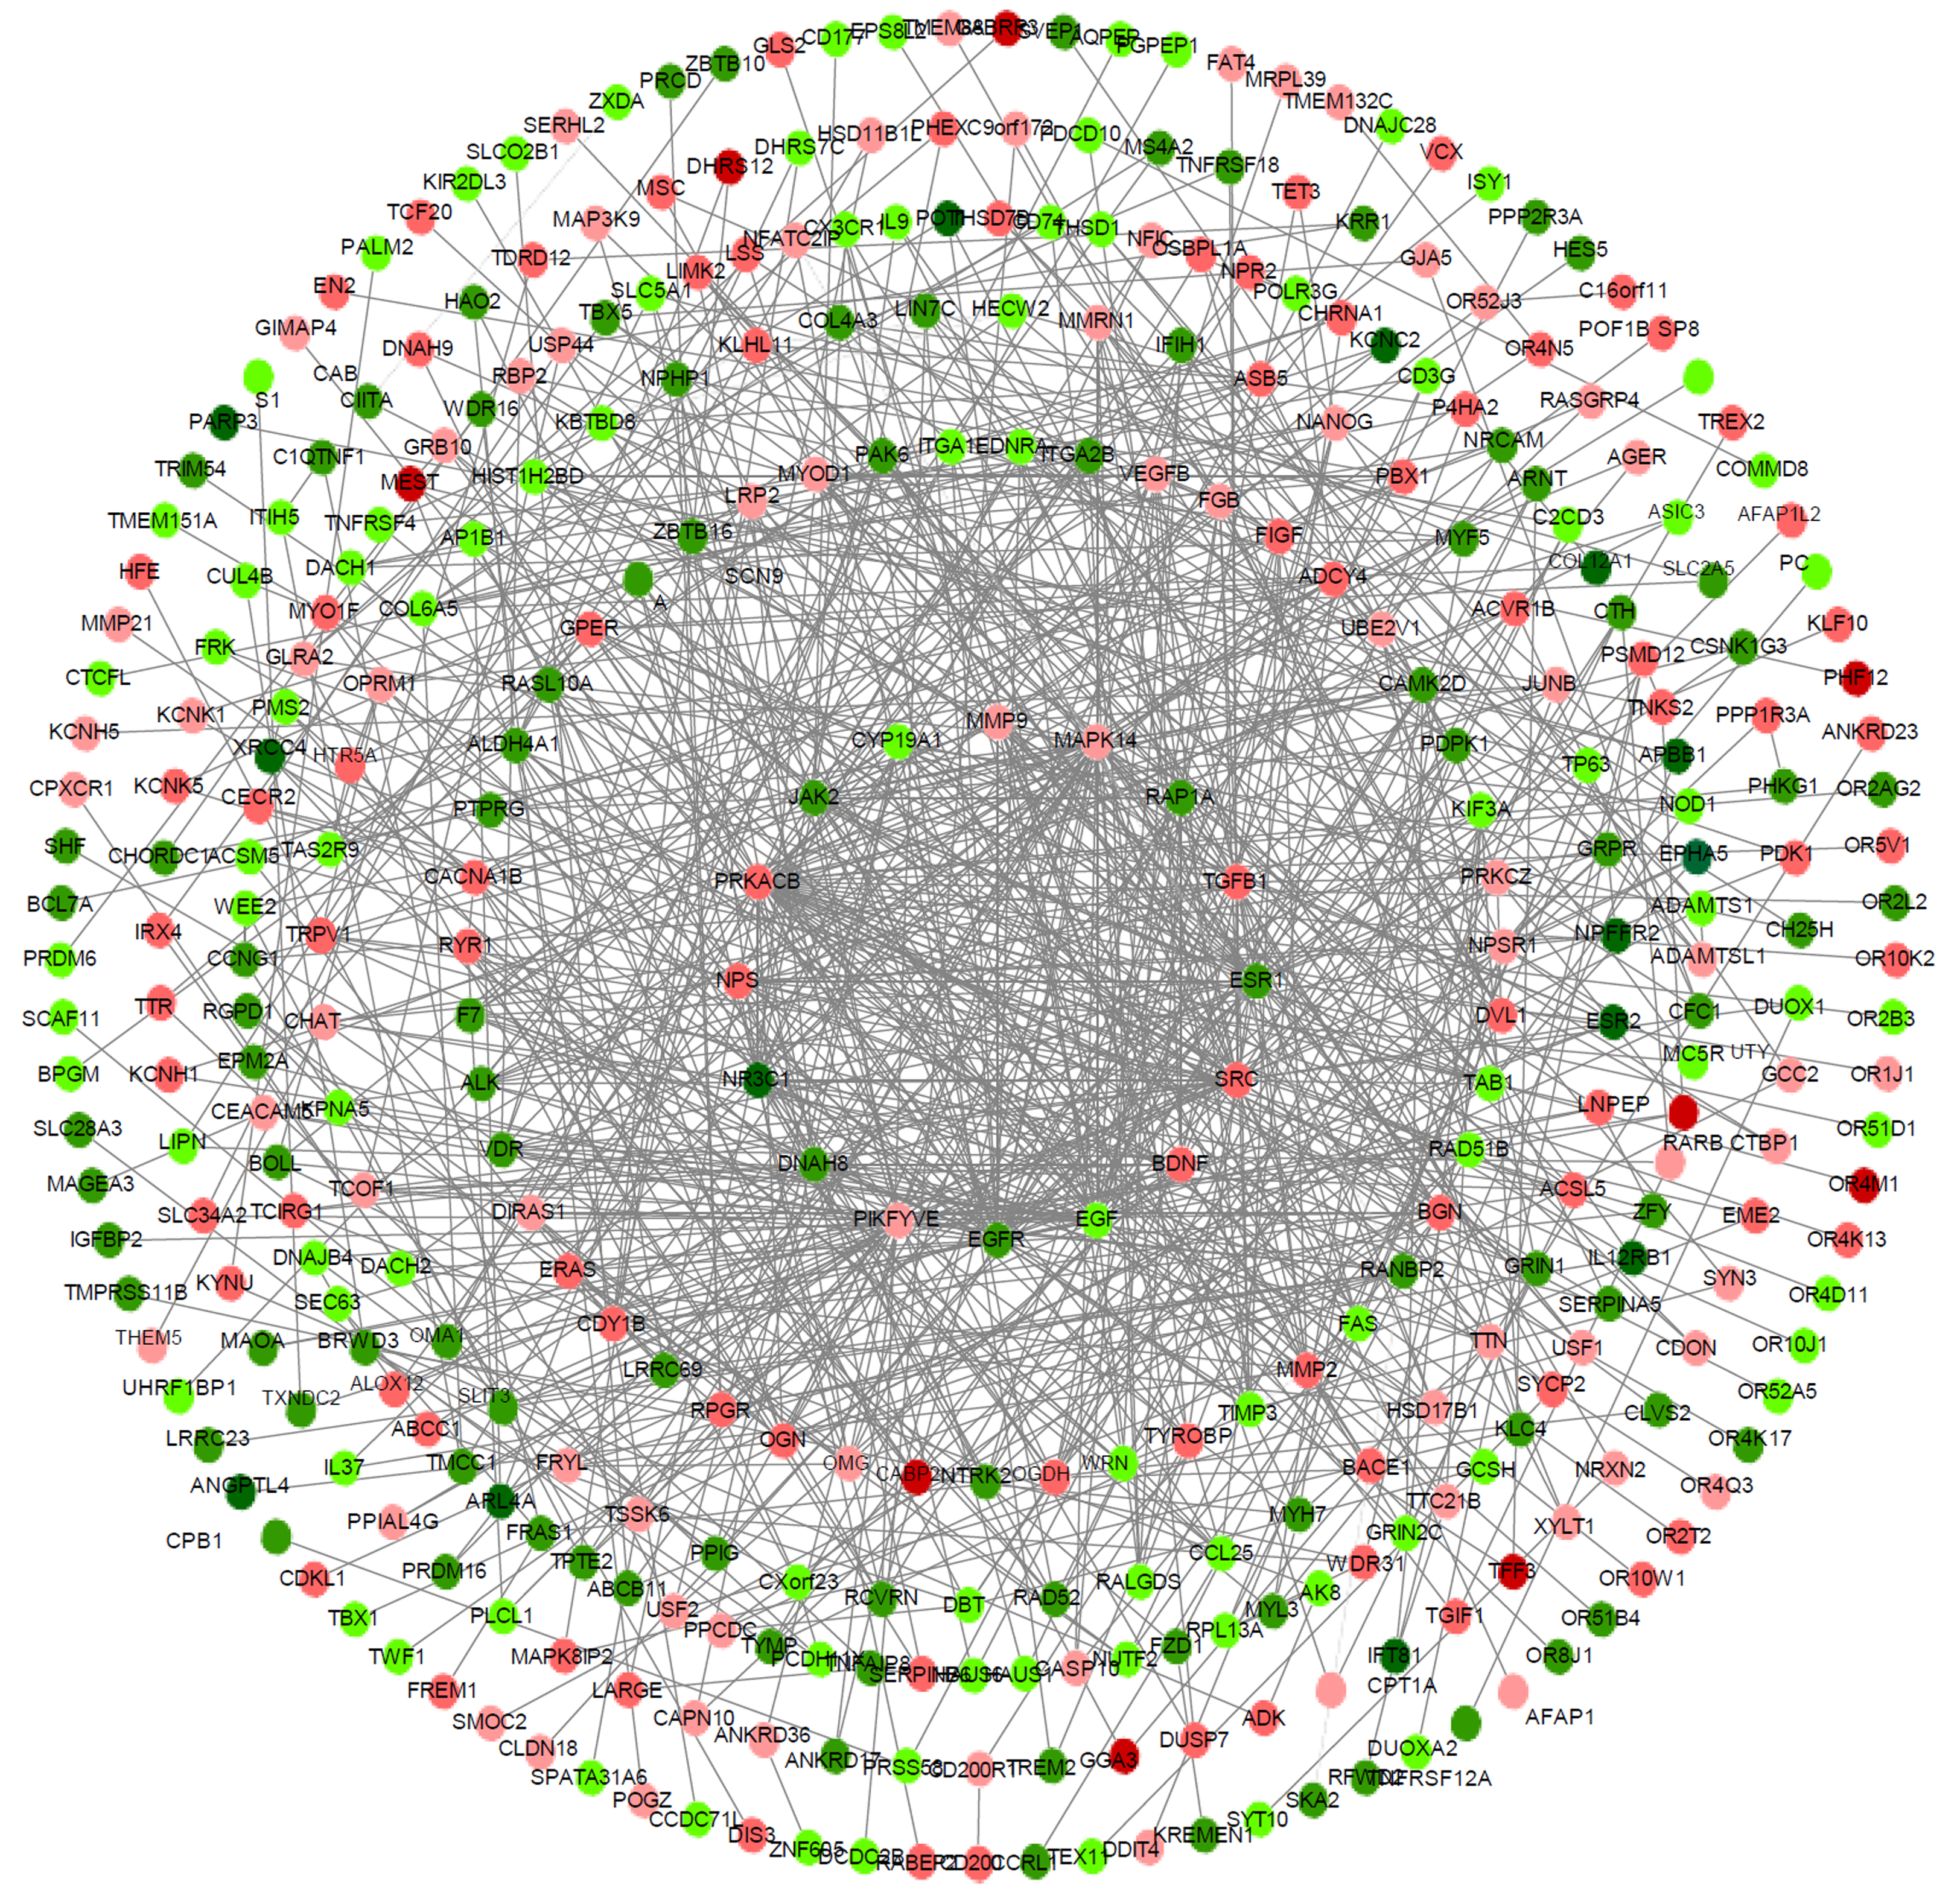
Figure 3 Protein-protein interaction network of differentially expressed genes in taurine-treated hepatic stellate cell samples.
The nearer the center, the higher the degrees; red coloring represents up-regulated genes; green coloring represents down-regulated genes; purple coloring represents genes from database; the shade is related to the change fold (darker colors indicate more apparent differences).
- Citation: Liang XQ, Liang J, Zhao XF, Wang XY, Deng X. Integrated network analysis of transcriptomic and protein-protein interaction data in taurine-treated hepatic stellate cells. World J Gastroenterol 2019; 25(9): 1067-1079
- URL: https://www.wjgnet.com/1007-9327/full/v25/i9/1067.htm
- DOI: https://dx.doi.org/10.3748/wjg.v25.i9.1067


