Copyright
©The Author(s) 2019.
World J Gastroenterol. Feb 14, 2019; 25(6): 683-695
Published online Feb 14, 2019. doi: 10.3748/wjg.v25.i6.683
Published online Feb 14, 2019. doi: 10.3748/wjg.v25.i6.683
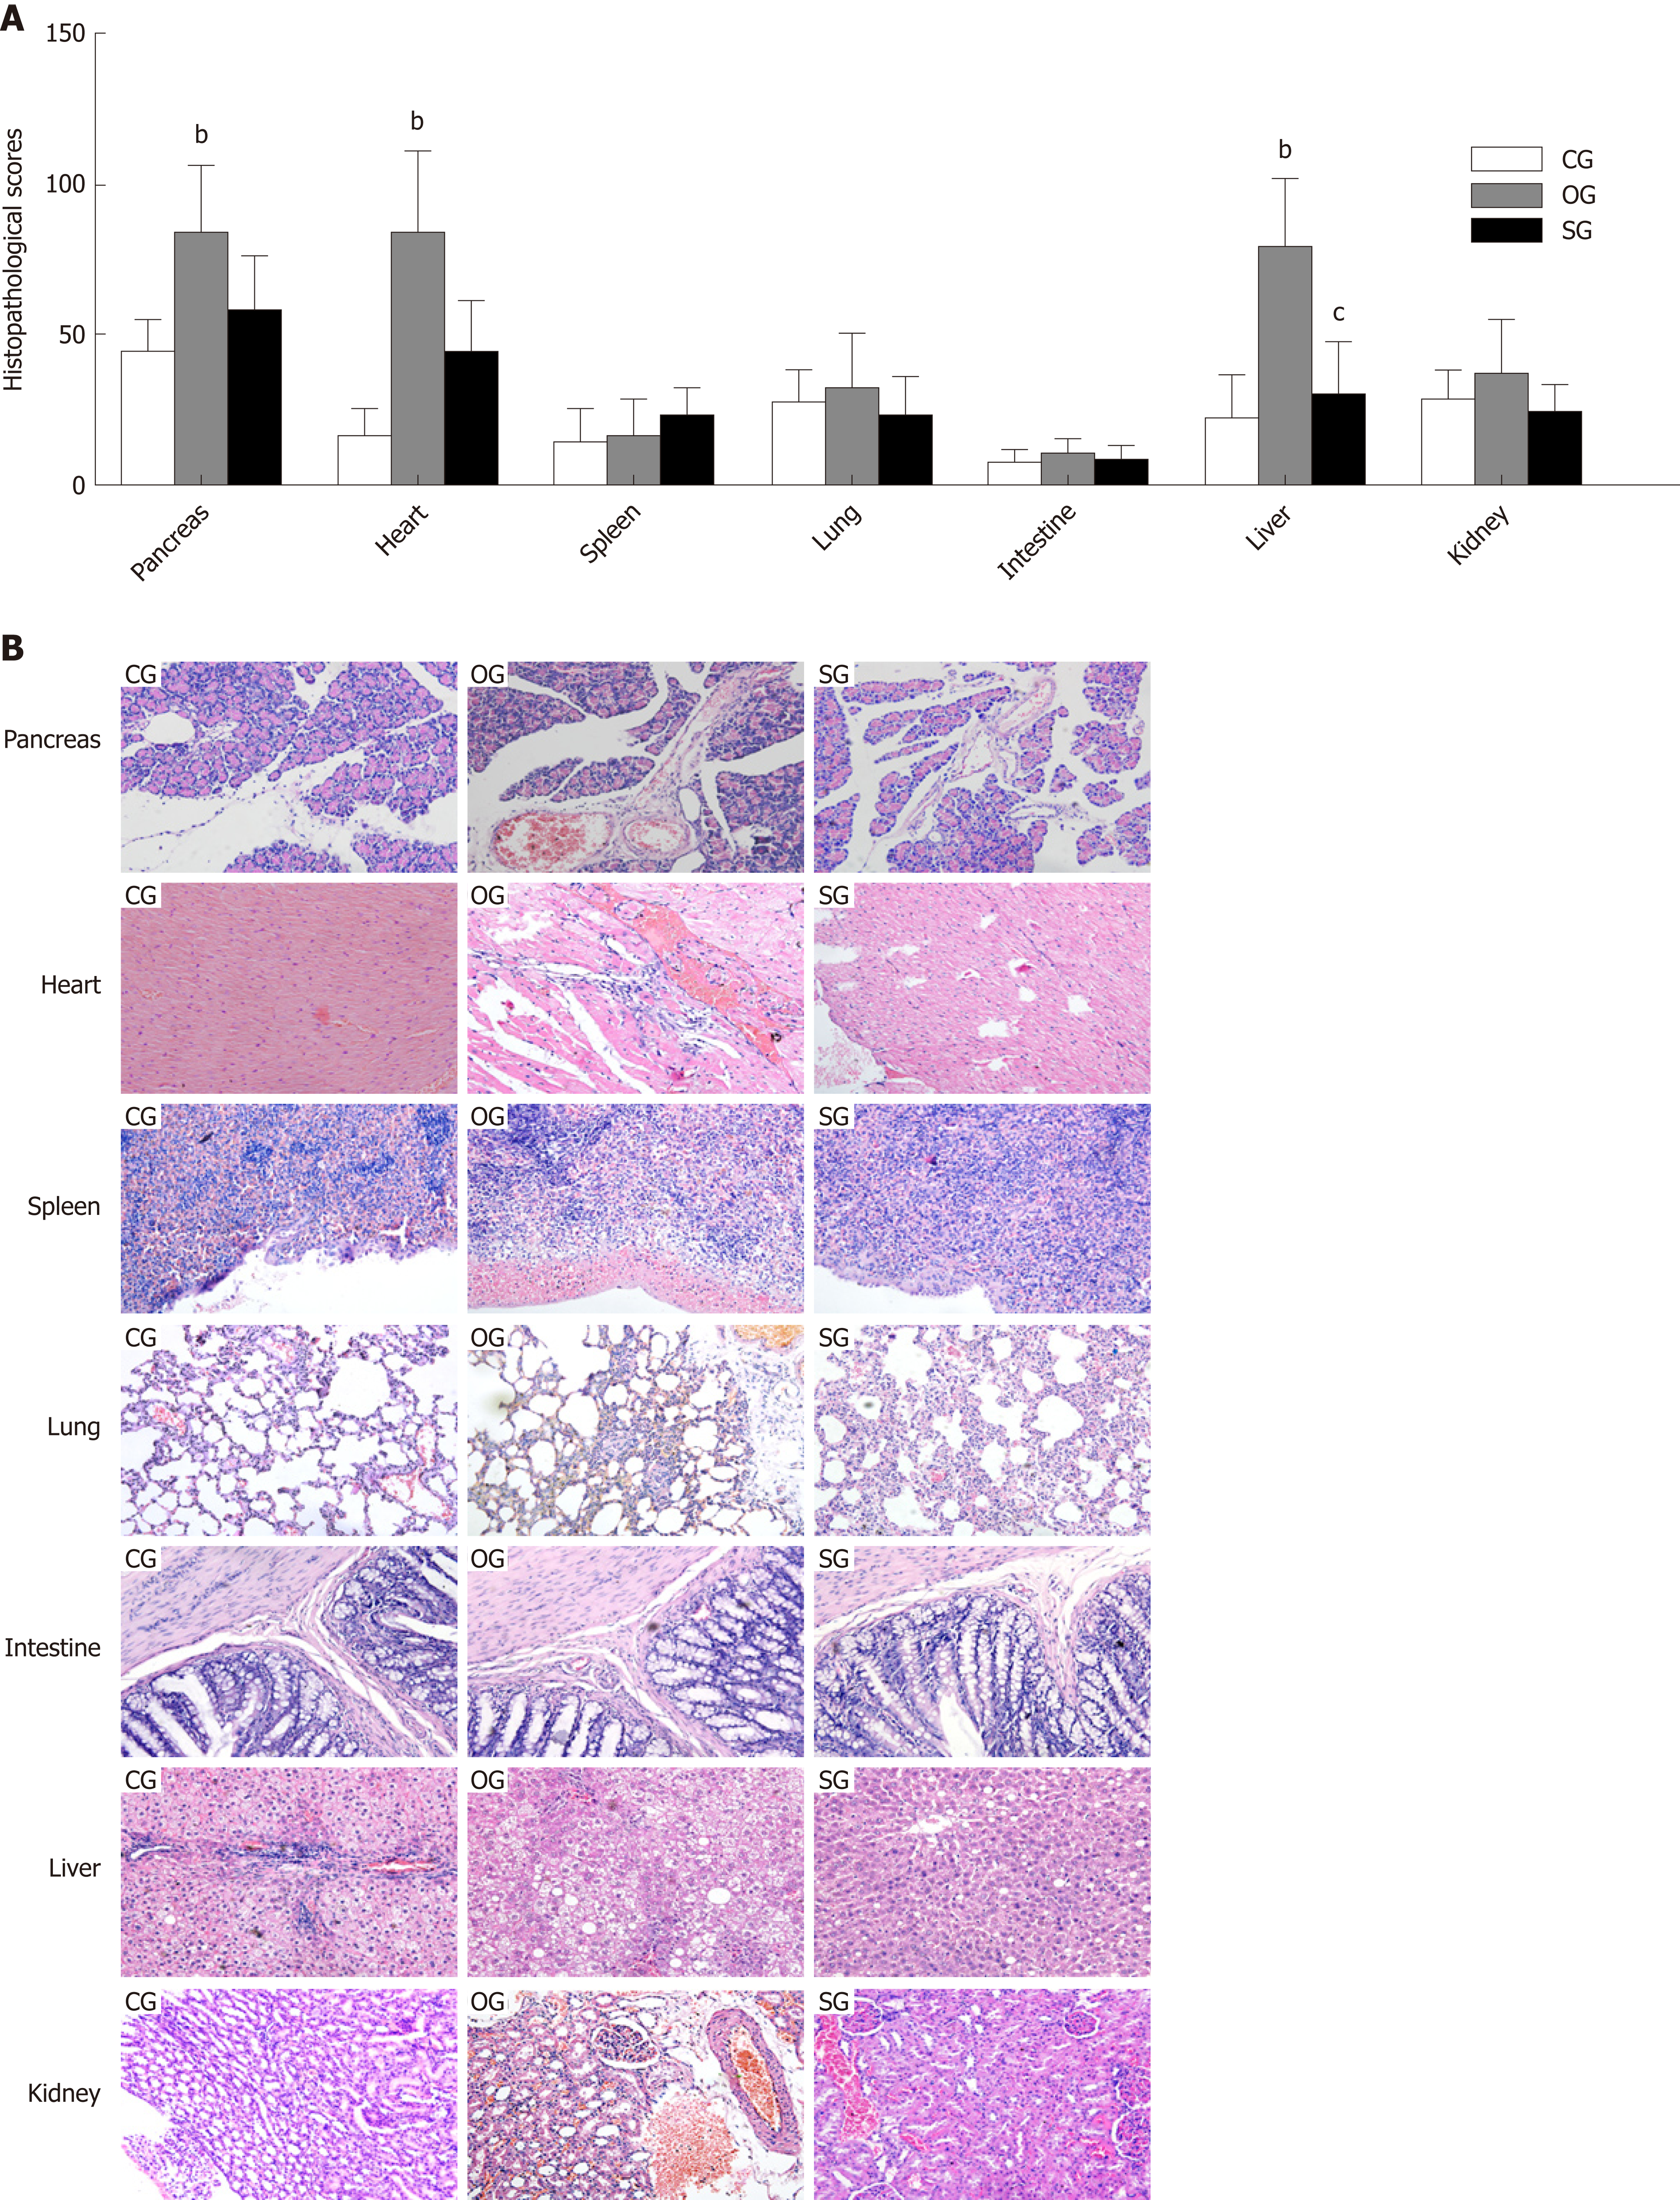
Figure 3 Histological scores and pathological images of multiple organs in rats.
A: Histological scores of the pancreas, heart, spleen, lung, intestine, liver, and kidney. B: Pathological images of the pancreas, heart, spleen, lung, intestine, liver, and kidney (× 200). The results are presented as the mean ± SD. bP < 0.01 vs the control group, cP < 0.05 vs the obese group. CG: Control group; OG: Obese group; SG: Sheng-jiang powder treatment group.
- Citation: Miao YF, Kang HX, Li J, Zhang YM, Ren HY, Zhu L, Chen H, Yuan L, Su H, Wan MH, Tang WF. Effect of Sheng-jiang powder on multiple-organ inflammatory injury in acute pancreatitis in rats fed a high-fat diet. World J Gastroenterol 2019; 25(6): 683-695
- URL: https://www.wjgnet.com/1007-9327/full/v25/i6/683.htm
- DOI: https://dx.doi.org/10.3748/wjg.v25.i6.683


