Copyright
©The Author(s) 2019.
World J Gastroenterol. Dec 21, 2019; 25(47): 6813-6822
Published online Dec 21, 2019. doi: 10.3748/wjg.v25.i47.6813
Published online Dec 21, 2019. doi: 10.3748/wjg.v25.i47.6813
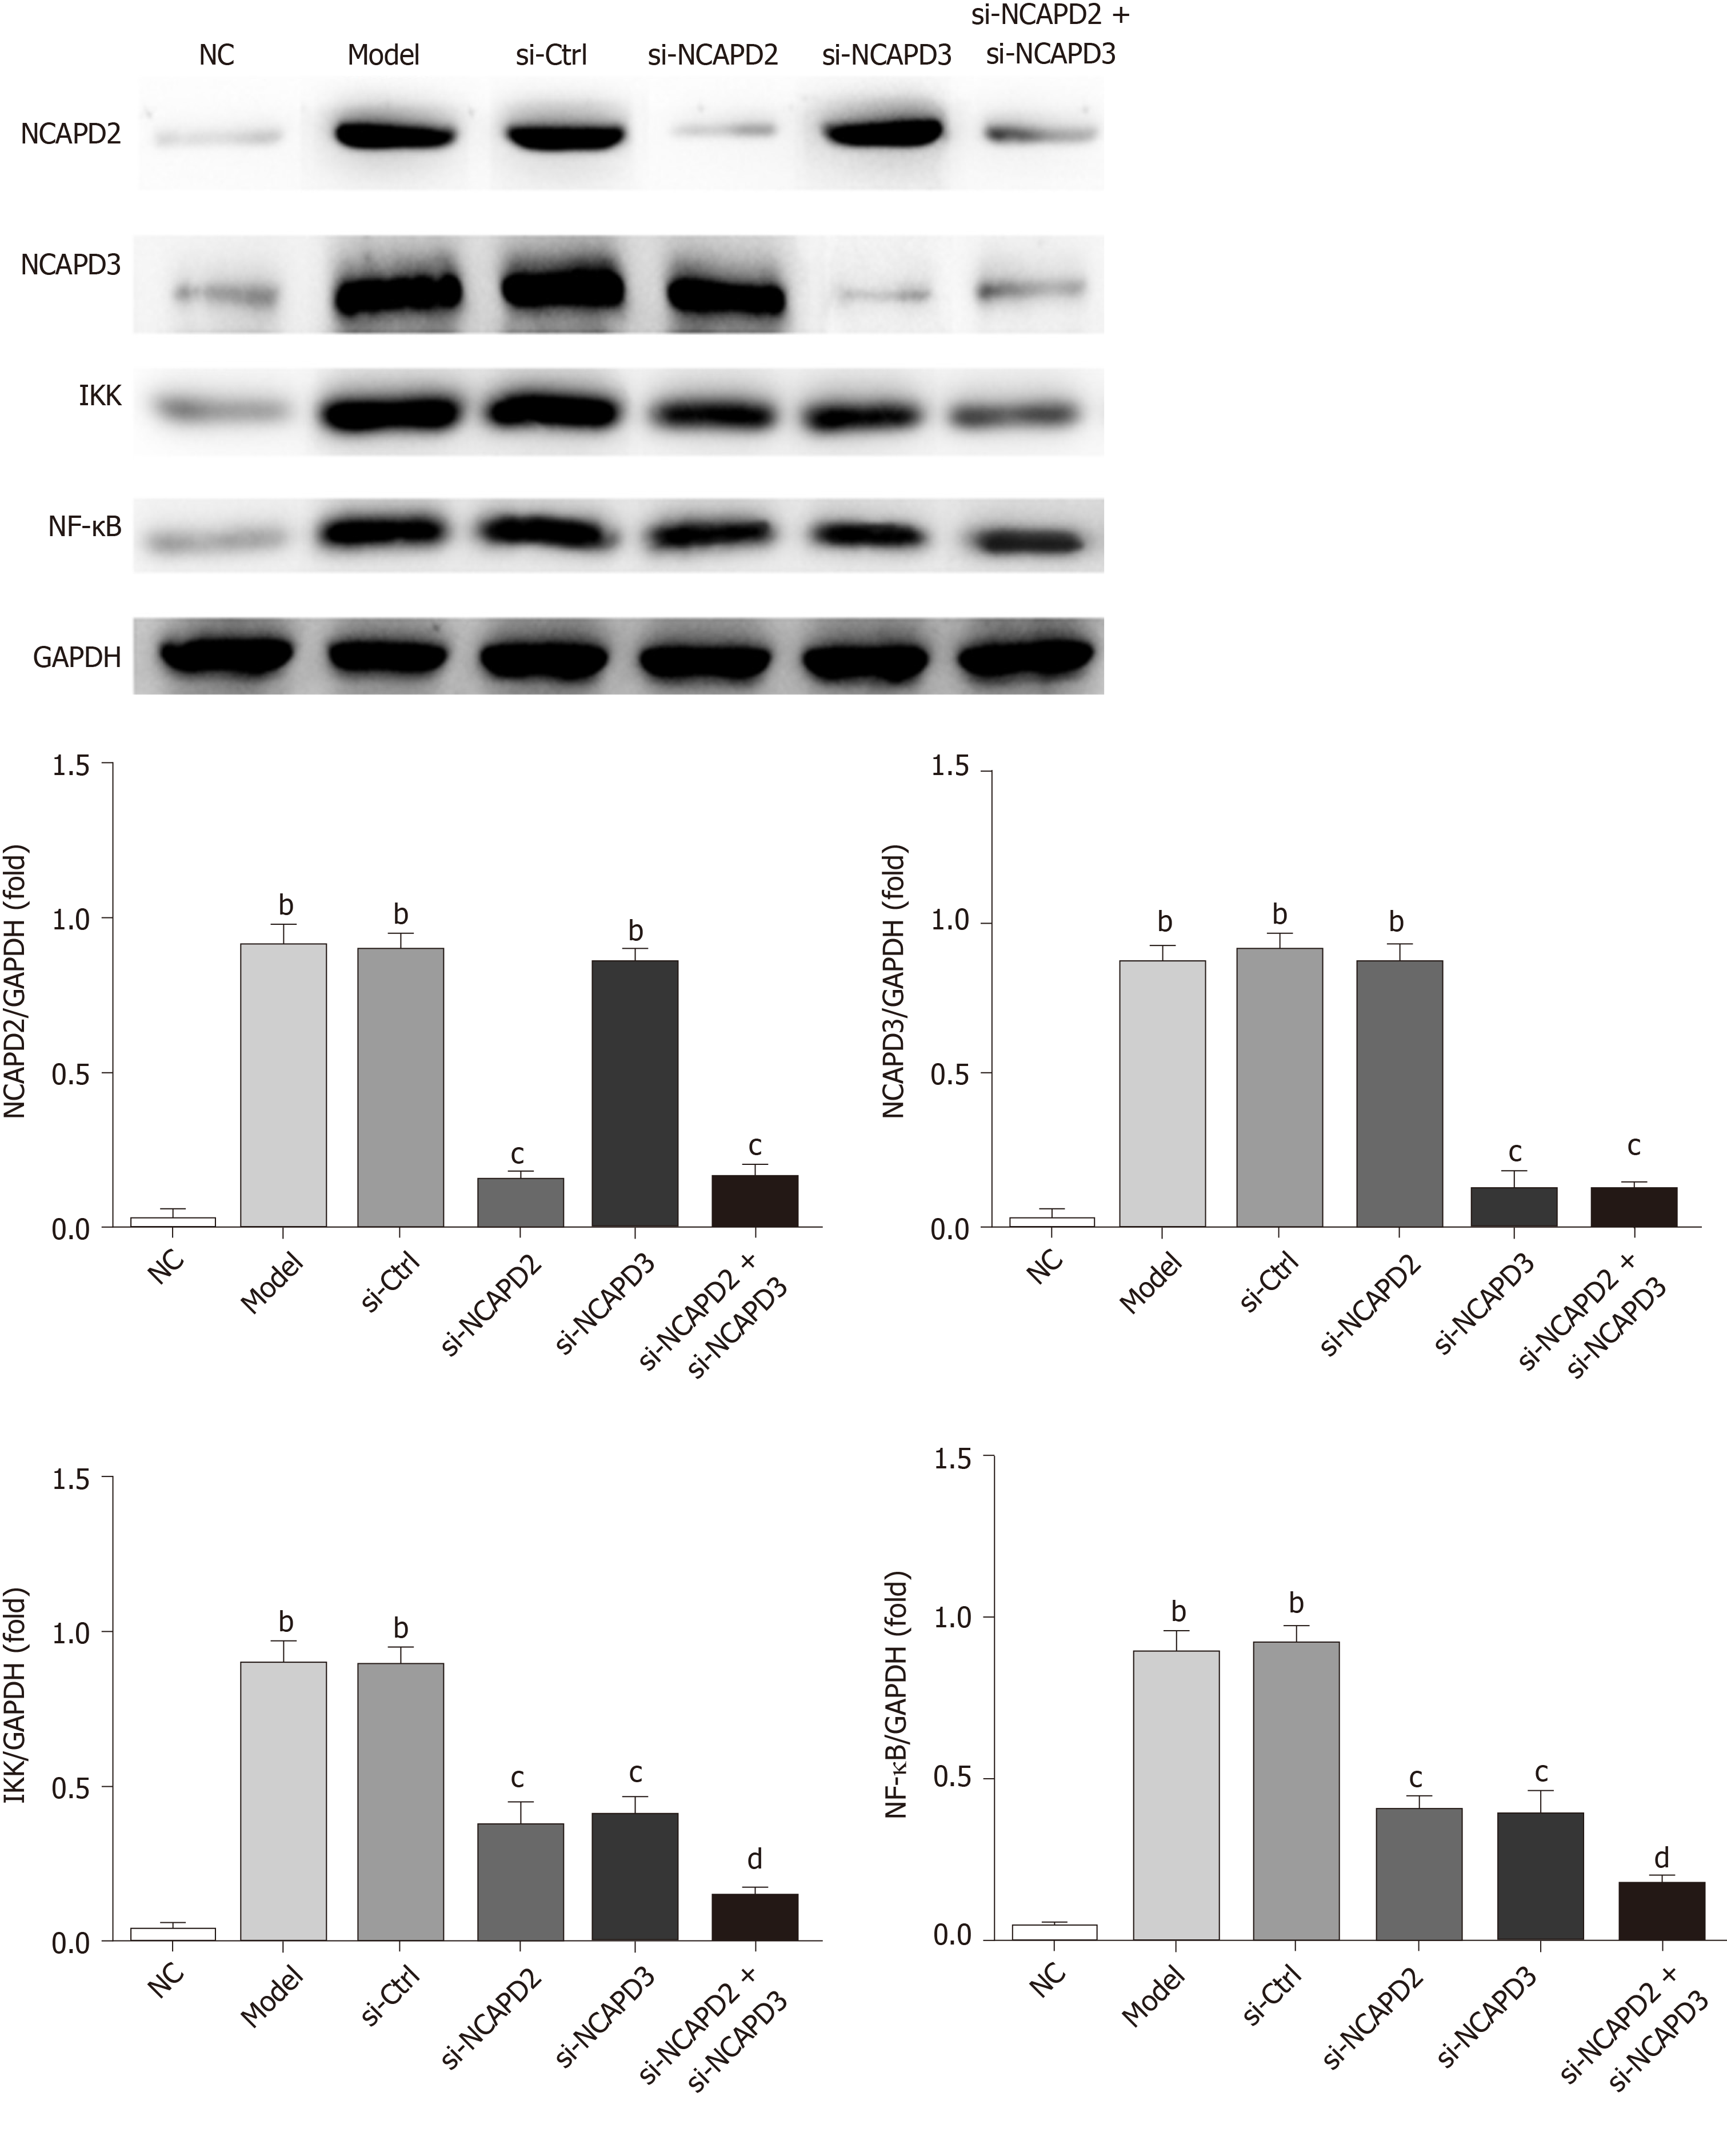
Figure 3 The relative protein expression levels by Western blot assay.
bP < 0.001 vs NC; cP < 0.01, dP < 0.001 vs Model. NC: Normal control group; Model: Ulcerative colitis (UC) model group; si-Ctrl: Transfected with empty vector based on the UC model; si-NCAPD2: Transfected with si-NCAPD2 based on the UC model; si-NCAPD3: Transfected with si-NCAPD3 based on the UC model; si-NCAPD2 + si-NCAPD3: Transfected with si-NCAPD2 and si-NCAPD3 based on the UC model; NCAPD2: Non-SMC condensin I complex subunit D2; NCAPD3: Non-SMC condensin II complex subunit D3.
- Citation: Yuan CW, Sun XL, Qiao LC, Xu HX, Zhu P, Chen HJ, Yang BL. Non-SMC condensin I complex subunit D2 and non-SMC condensin II complex subunit D3 induces inflammation via the IKK/NF-κB pathway in ulcerative colitis. World J Gastroenterol 2019; 25(47): 6813-6822
- URL: https://www.wjgnet.com/1007-9327/full/v25/i47/6813.htm
- DOI: https://dx.doi.org/10.3748/wjg.v25.i47.6813


