Copyright
©The Author(s) 2019.
World J Gastroenterol. Dec 7, 2019; 25(45): 6634-6652
Published online Dec 7, 2019. doi: 10.3748/wjg.v25.i45.6634
Published online Dec 7, 2019. doi: 10.3748/wjg.v25.i45.6634
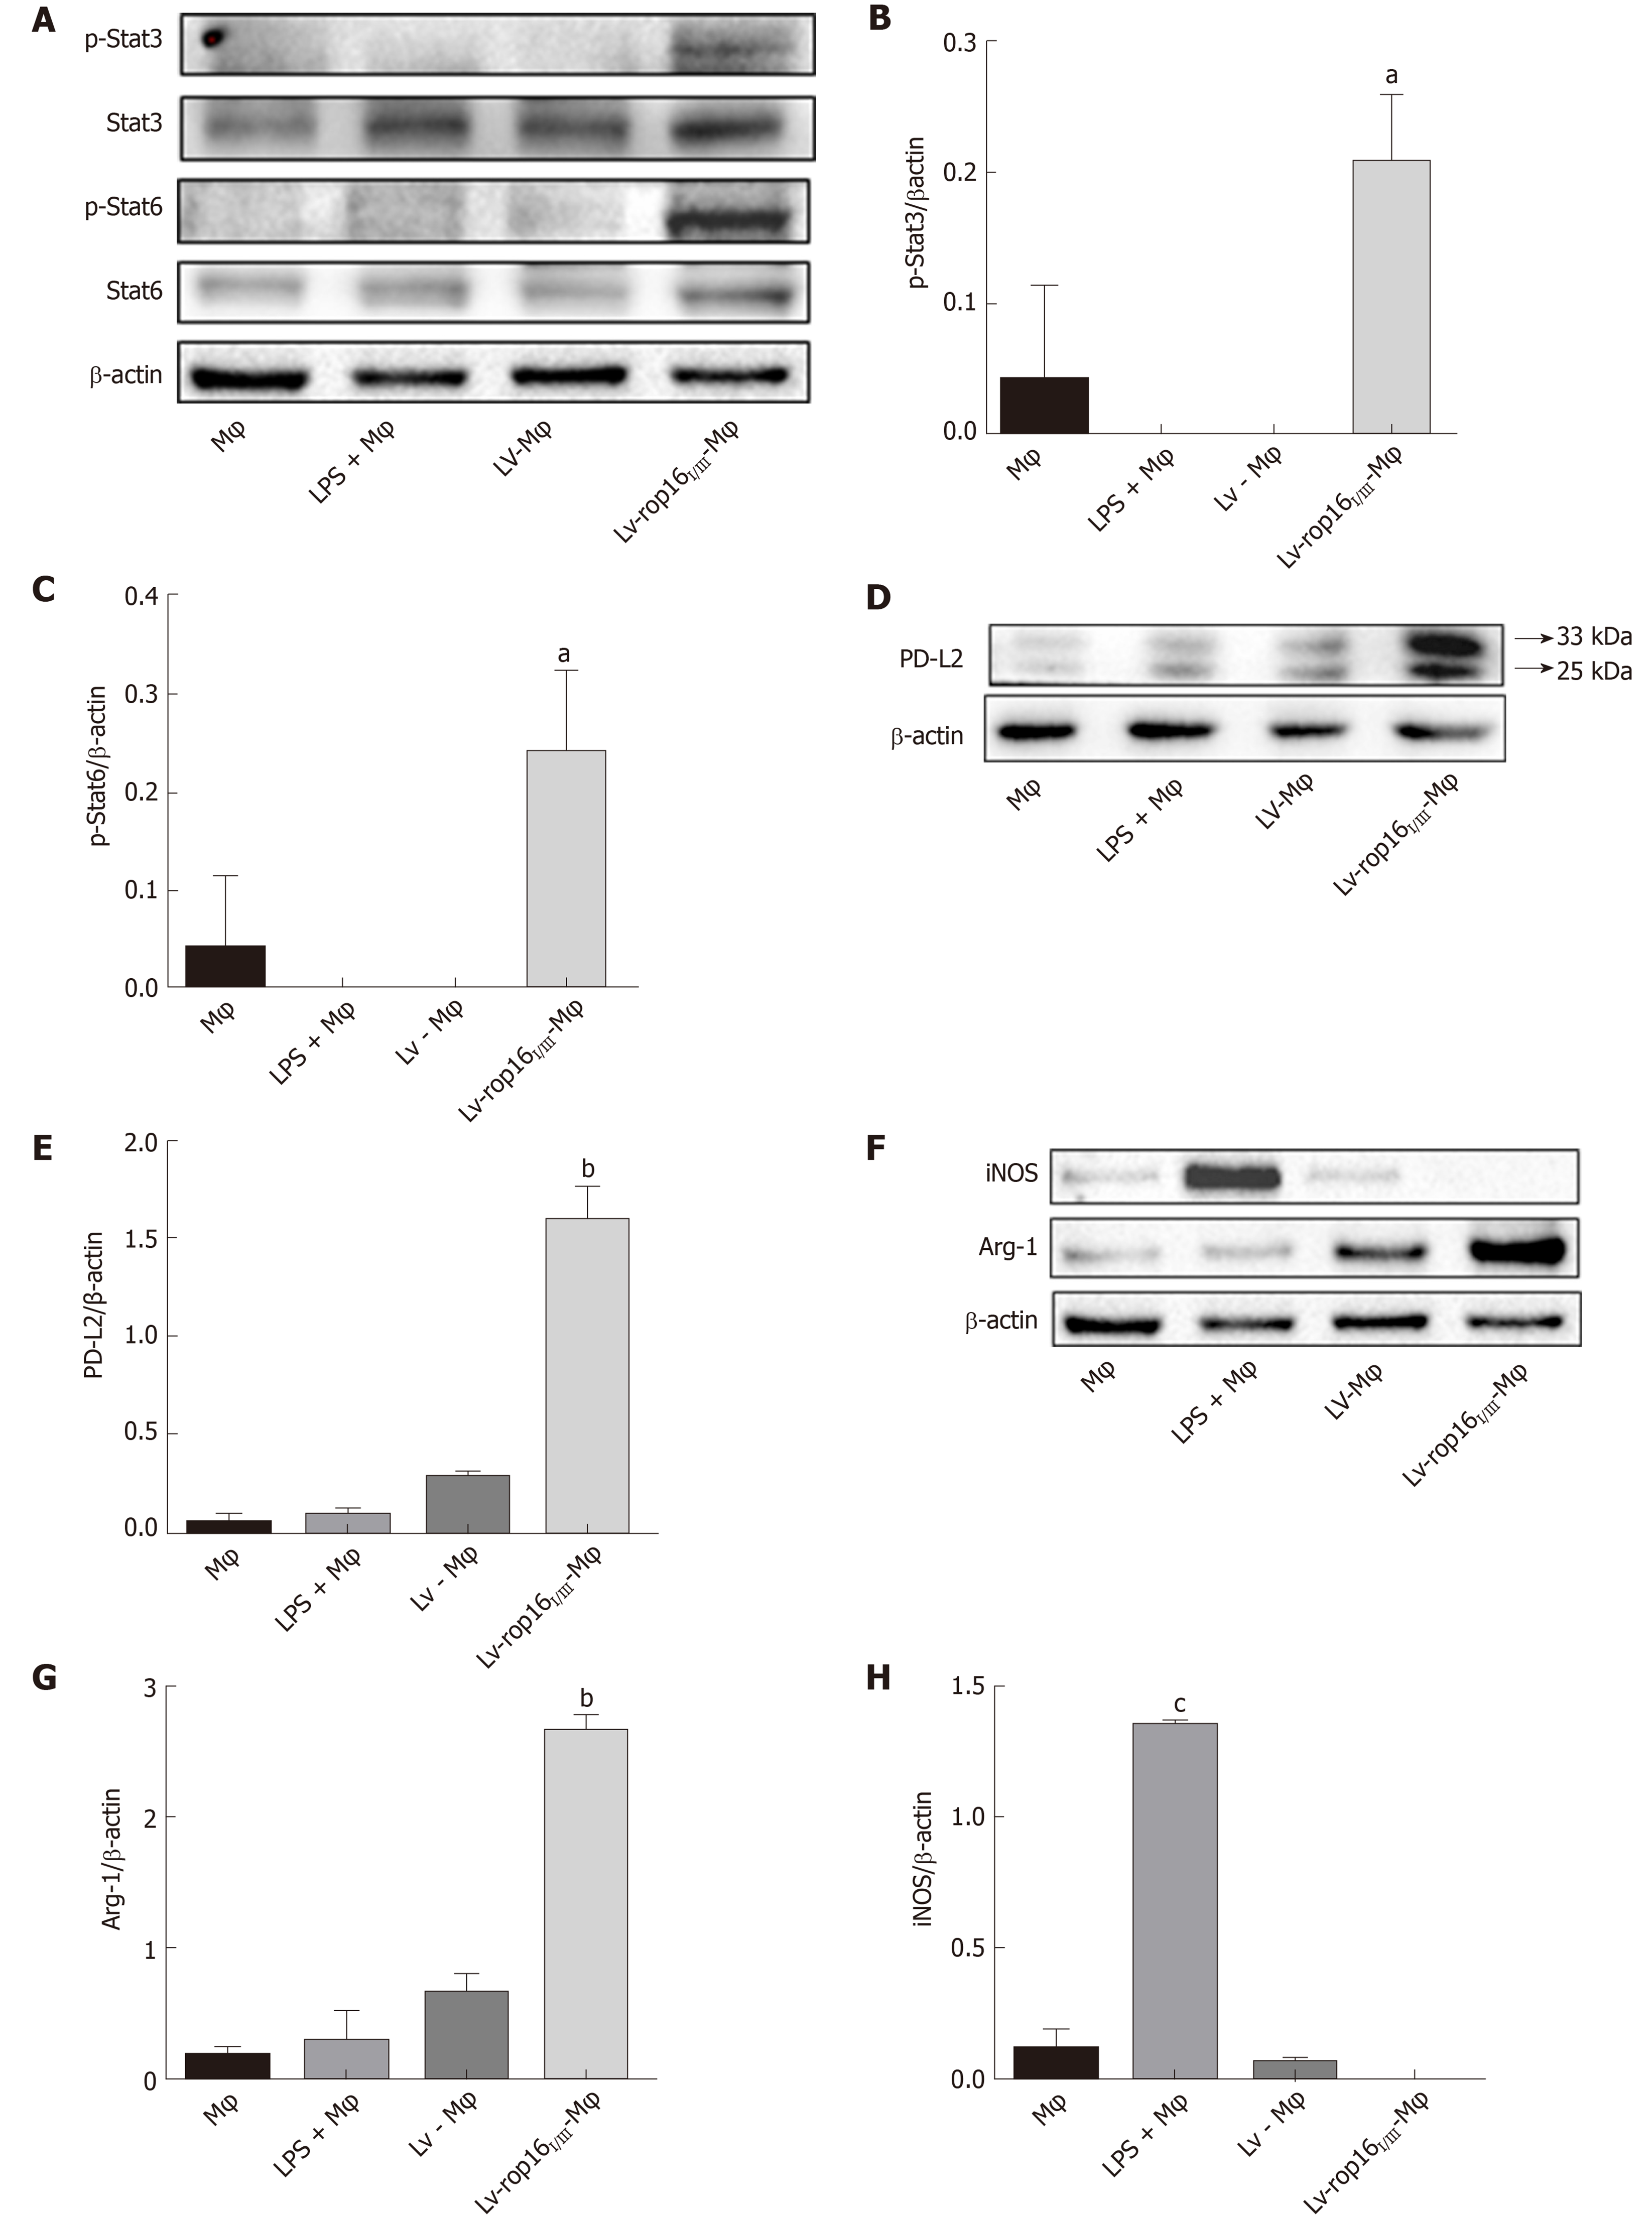
Figure 4 Western blotting analysis for the detection of M1 and M2 cell signatures.
A-C: LV-rop16I/III polarized macrophages to M2 cells via the phosphorylation of Stat3 and Stat6. The expression of p-Stat3 and p-Stat6 was significantly elevated in M2 cells relative to normal macrophages. D and E: The expression of PD-L2 (33 kDa) was obviously increased in M2 cells while Lv-Mφ was significantly increased in M1 cells relative to macrophages. F-H: The expression of Arg-1 was obviously increased in M2 cells while iNOS was significantly increased in M1 cells relative to macrophages. aP < 0.01 vs Lv-Mφ; bP < 0.001 vs Lv-Mφ; cP < 0.001 vs Mφ. Stat3: Signal transducer and activator of transcription 3; Stat6: Signal transducer and activator of transcription 6; p-Stat3: Phosphorylate signal transducer and activator of transcription 3; p-Stat6: Phosphorylate signal transducer and activator of transcription 6; iNOS: Inducible nitric oxide synthase; PD-L2: Programmed death ligand-2; Arg-1: Arginase-1; Mφ: Macrophages; LPS: Lipopolysaccharide; LV-Mφ: Lentivirus transfer into macrophages; LV-rop16I/III-Mφ: Lentivirus-rop16I/III transfer into macrophages.
- Citation: Xu YW, Xing RX, Zhang WH, Li L, Wu Y, Hu J, Wang C, Luo QL, Shen JL, Chen X. Toxoplasma ROP16I/III ameliorated inflammatory bowel diseases via inducing M2 phenotype of macrophages. World J Gastroenterol 2019; 25(45): 6634-6652
- URL: https://www.wjgnet.com/1007-9327/full/v25/i45/6634.htm
- DOI: https://dx.doi.org/10.3748/wjg.v25.i45.6634


