Copyright
©The Author(s) 2019.
World J Gastroenterol. Nov 28, 2019; 25(44): 6508-6526
Published online Nov 28, 2019. doi: 10.3748/wjg.v25.i44.6508
Published online Nov 28, 2019. doi: 10.3748/wjg.v25.i44.6508
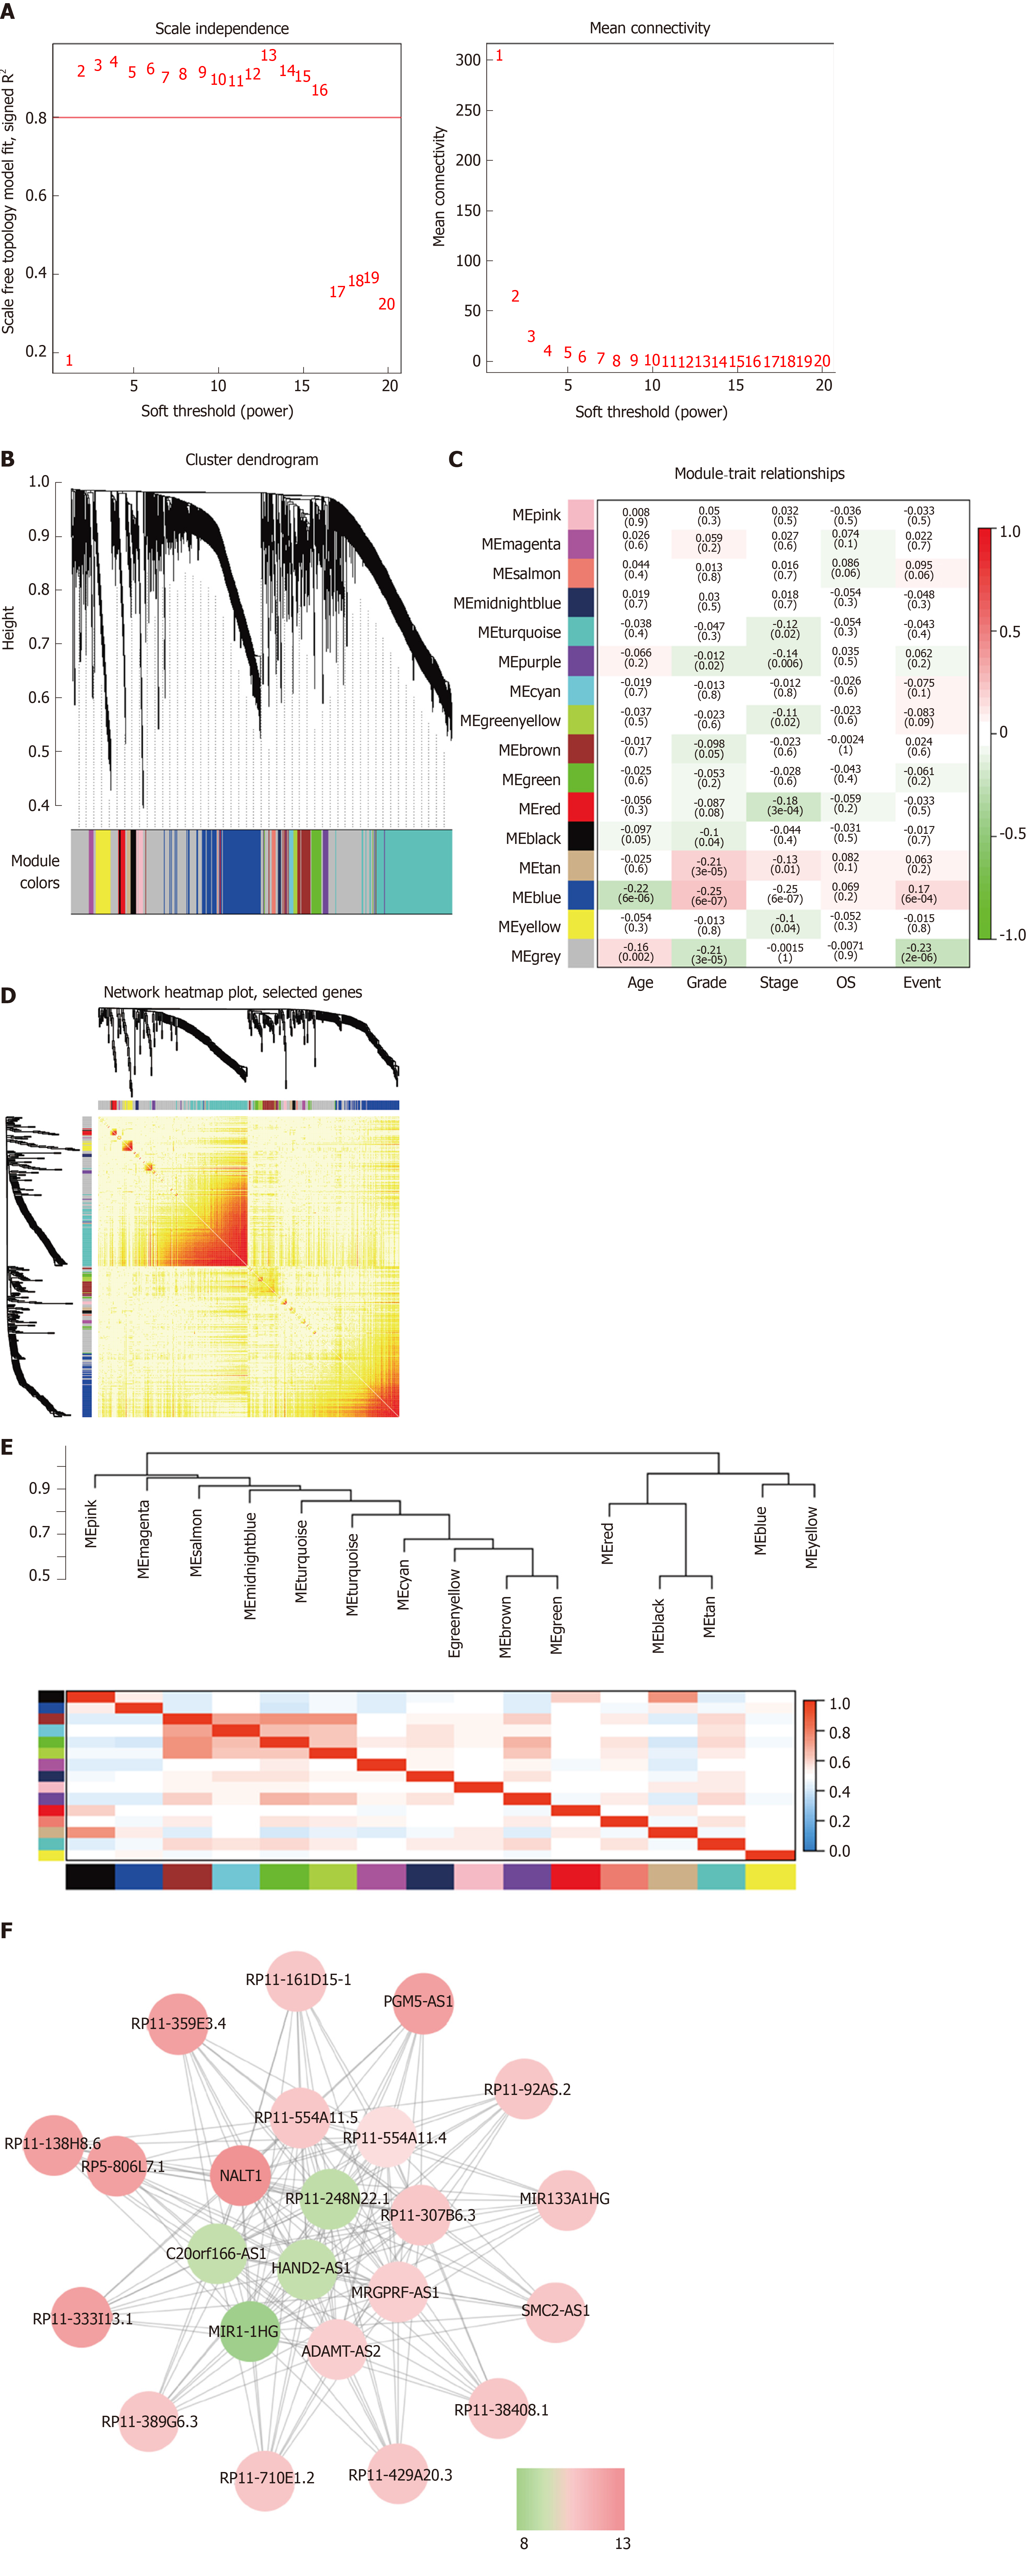
Figure 2 Weighted gene coexpression network analysis identify function module.
A: The soft-thresholding powers (β) of scale-free fit index and mean connectivity; B: Cluster dendrogram obtained by hierarchical clustering of adjacency-based dissimilarity; C: Heatmap of the correlation between module and gastric cancer clinical traits; D: Topological overlap matrix plot; E: Hierarchical clustering and heatmap of eigengene adjacency. The color bars on left and below indicate the module of each row or column; F: Weighted coexpression network for blue-module lncRNAs (Node colors are according to the molecular complex detection score). LncRNAs: Long noncoding RNAs.
- Citation: Piao HY, Guo S, Wang Y, Zhang J. Long noncoding RNA NALT1-induced gastric cancer invasion and metastasis via NOTCH signaling pathway. World J Gastroenterol 2019; 25(44): 6508-6526
- URL: https://www.wjgnet.com/1007-9327/full/v25/i44/6508.htm
- DOI: https://dx.doi.org/10.3748/wjg.v25.i44.6508


