Copyright
©The Author(s) 2019.
World J Gastroenterol. Nov 21, 2019; 25(43): 6404-6415
Published online Nov 21, 2019. doi: 10.3748/wjg.v25.i43.6404
Published online Nov 21, 2019. doi: 10.3748/wjg.v25.i43.6404
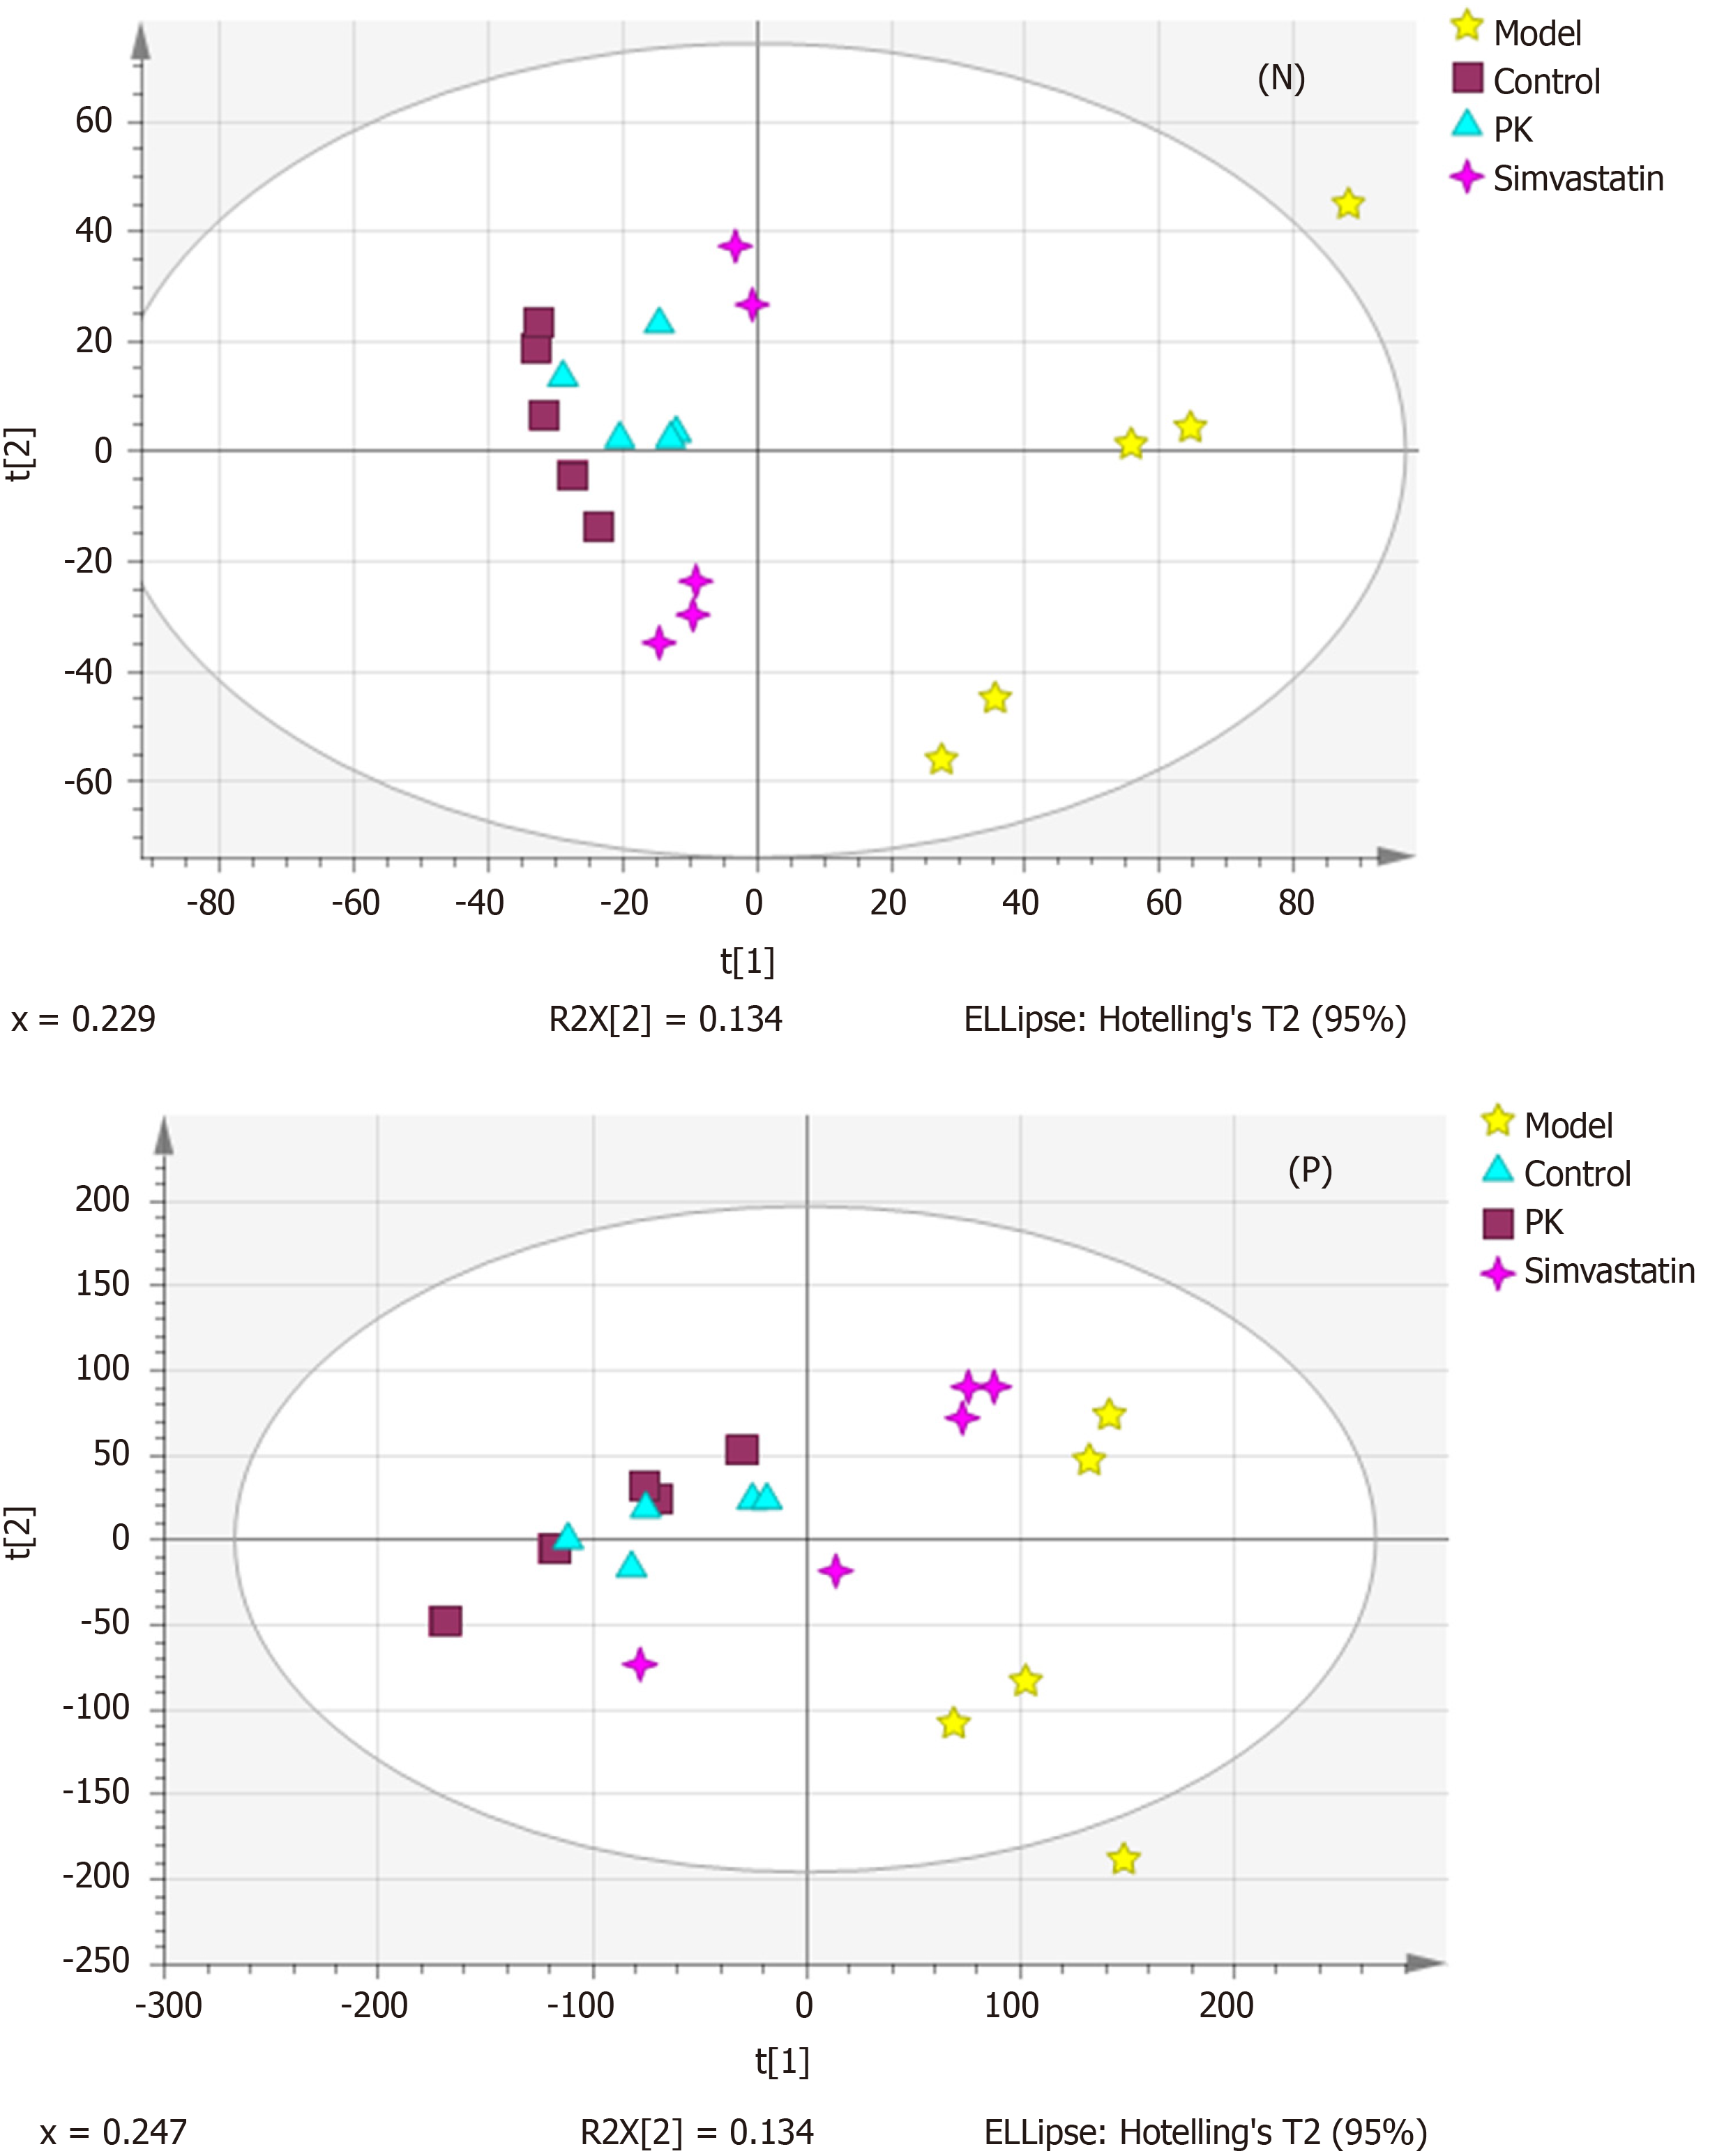
Figure 3 Principal components analysis score plots of the mitochondrial samples in the negative and positive ion mode.
Although the significant differences were noticed among the sample sets within the same group, the four groups were almost separated, indicating significant differences in the metabolic state between them. PK: Polygonatum kingianum; N: Negative; P: Positive.
- Citation: Yang XX, Wei JD, Mu JK, Liu X, Li FJ, Li YQ, Gu W, Li JP, Yu J. Mitochondrial metabolomic profiling for elucidating the alleviating potential of Polygonatum kingianum against high-fat diet-induced nonalcoholic fatty liver disease. World J Gastroenterol 2019; 25(43): 6404-6415
- URL: https://www.wjgnet.com/1007-9327/full/v25/i43/6404.htm
- DOI: https://dx.doi.org/10.3748/wjg.v25.i43.6404


