Copyright
©The Author(s) 2019.
World J Gastroenterol. Oct 28, 2019; 25(40): 6053-6062
Published online Oct 28, 2019. doi: 10.3748/wjg.v25.i40.6053
Published online Oct 28, 2019. doi: 10.3748/wjg.v25.i40.6053
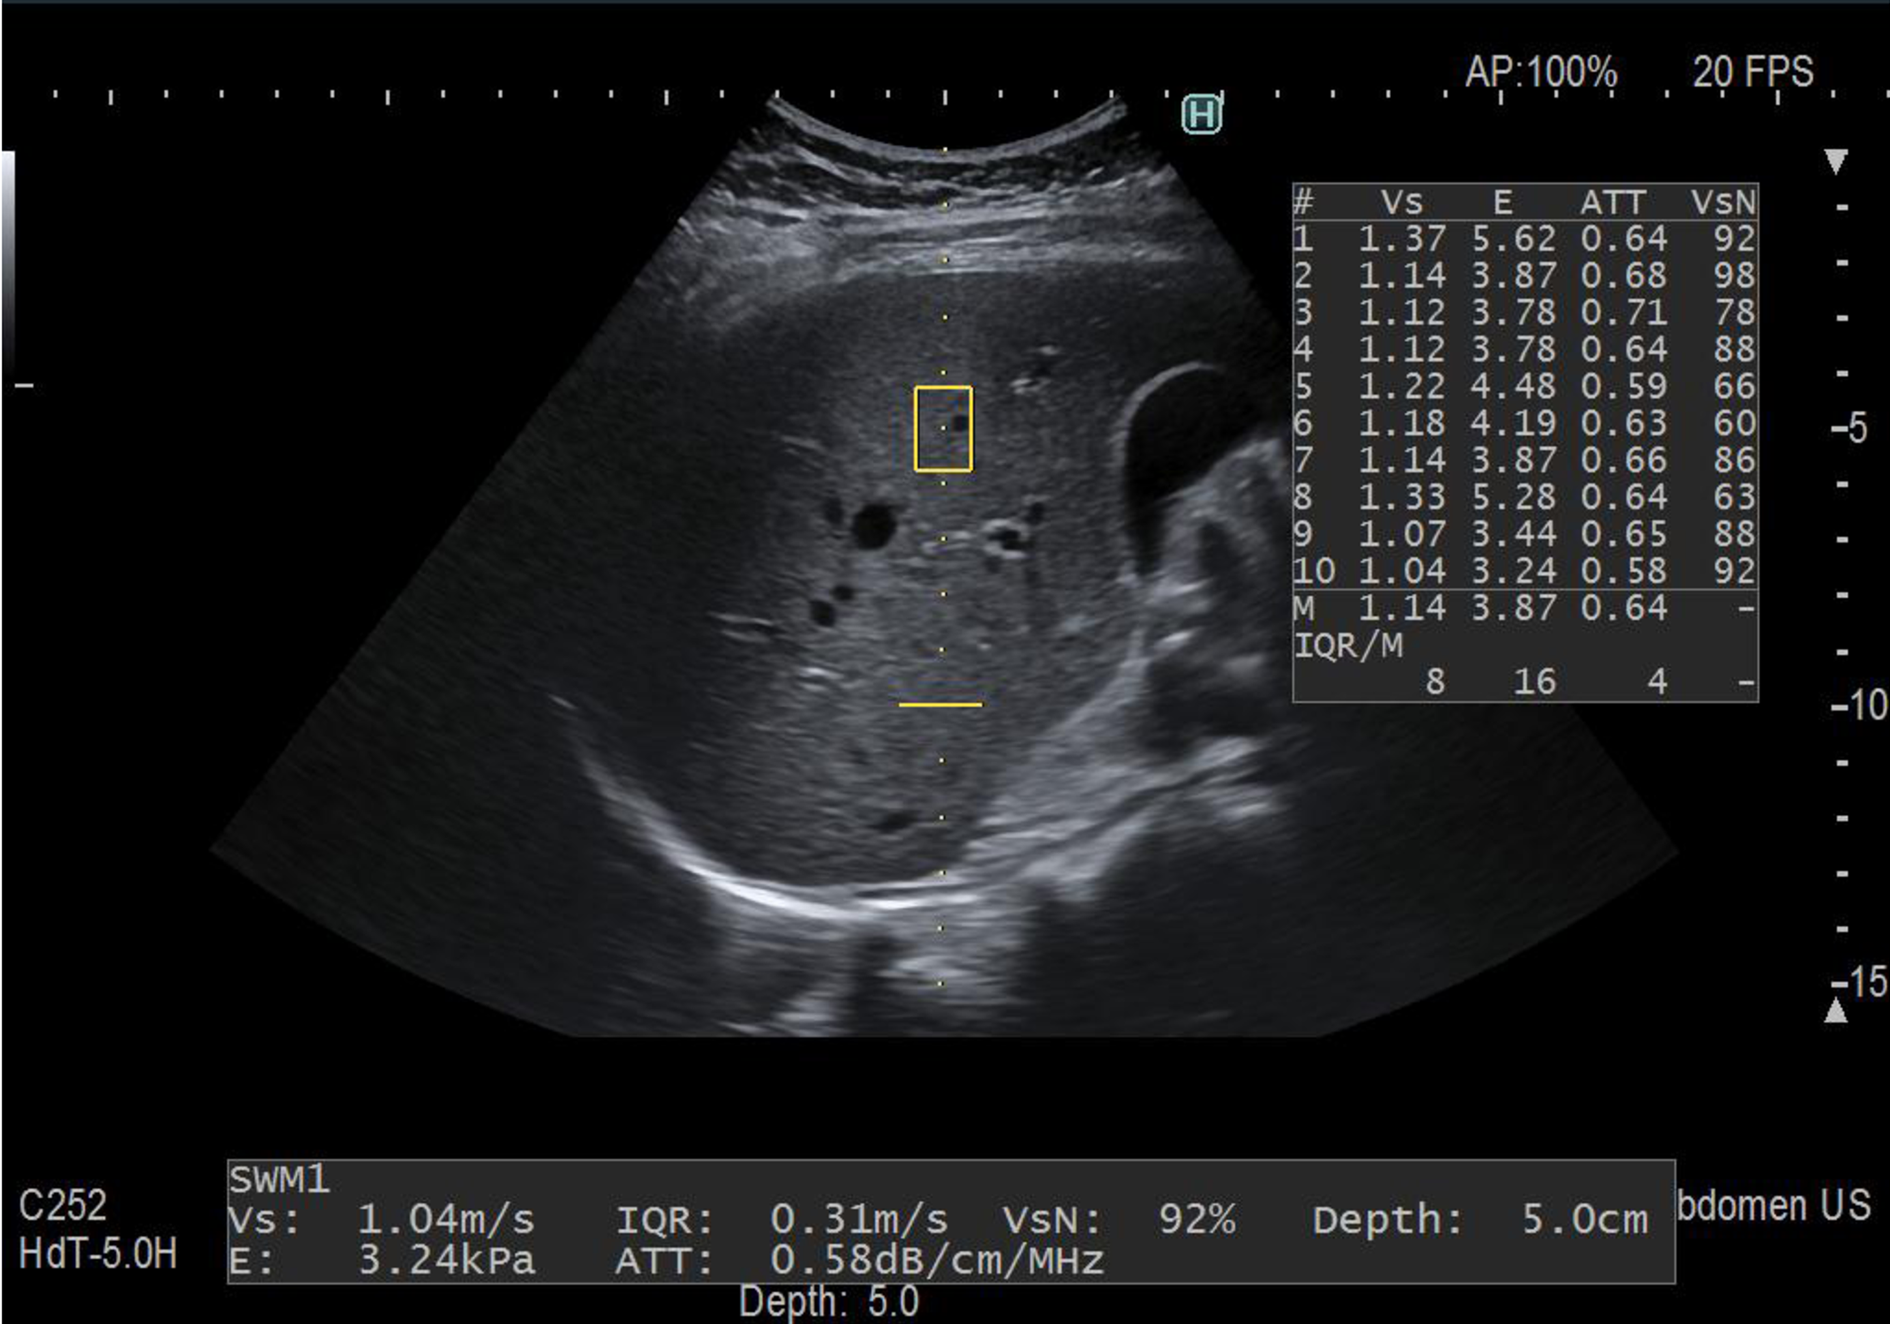
Figure 2 Intercostal scan of the right lobe of the liver, obtained with the Arietta 850 ultrasound system equipped with the ATT® technique.
The attenuation coefficient is calculated along the dotted yellow line and together with the assessment of liver stiffness. The maximum depth of ATT measurement is indicated by the horizontal continuous yellow line. The measurements are automatically displayed on the right side of the image on the monitor of the US system.
- Citation: Ferraioli G, Soares Monteiro LB. Ultrasound-based techniques for the diagnosis of liver steatosis. World J Gastroenterol 2019; 25(40): 6053-6062
- URL: https://www.wjgnet.com/1007-9327/full/v25/i40/6053.htm
- DOI: https://dx.doi.org/10.3748/wjg.v25.i40.6053


