Copyright
©The Author(s) 2019.
World J Gastroenterol. Jan 28, 2019; 25(4): 433-446
Published online Jan 28, 2019. doi: 10.3748/wjg.v25.i4.433
Published online Jan 28, 2019. doi: 10.3748/wjg.v25.i4.433
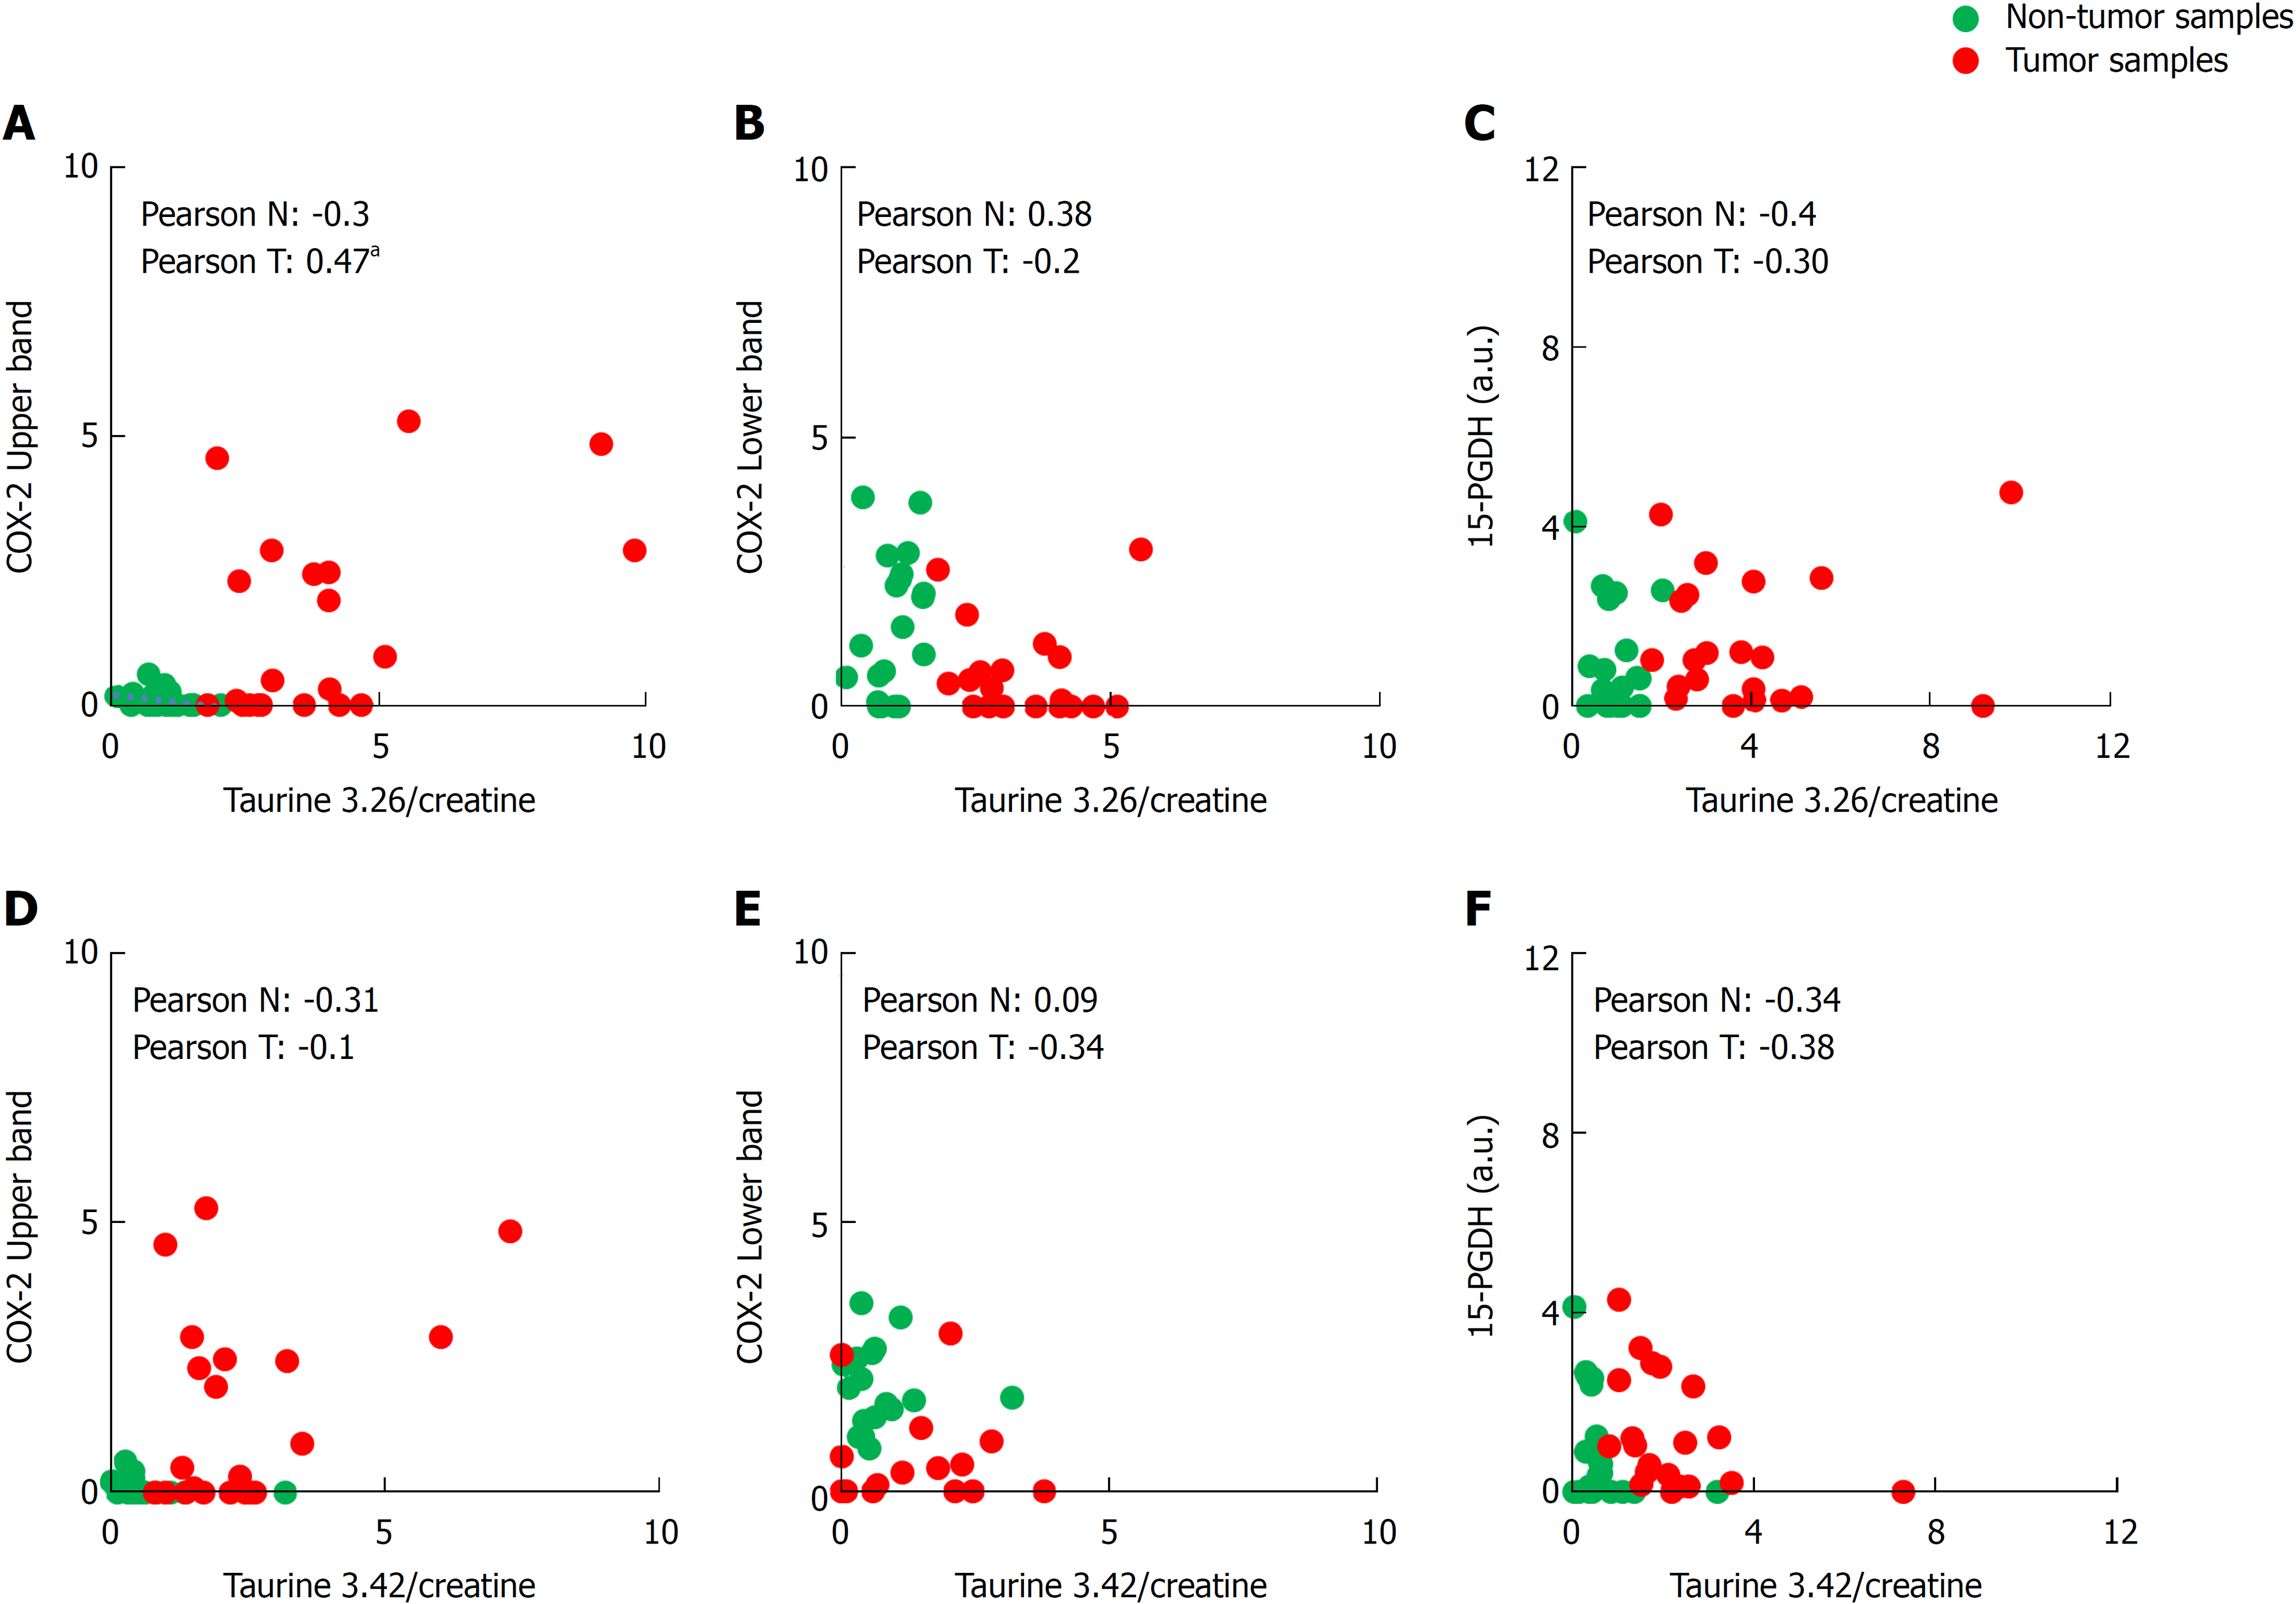
Figure 4 Biostatistical analysis of the correlation between the presence of cyclooxygenase-2 bands in western blot and both taurine peaks.
A-F: Statistical analysis was performed searching the correlation coefficient between the presence of upper or lower cyclooxygenase-2 band or 15-hydroxyprostaglandin dehydrogenase in western blot and the taurine peaks (3.26 and 3.42 δ ppm) levels of 29 Tumor/Non-tumor pairs of samples. The Pearson’s correlation coefficient is shown in each figure for non-tumor or tumor sample. aP ≤ 0.05. COX-2: Cyclooxygenase-2; 15-PGDH: 15-hydroxyprostaglandin dehydrogenase.
- Citation: Prieto P, Jaén RI, Calle D, Gómez-Serrano M, Núñez E, Fernández-Velasco M, Martín-Sanz P, Alonso S, Vázquez J, Cerdán S, Peinado MÁ, Boscá L. Interplay between post-translational cyclooxygenase-2 modifications and the metabolic and proteomic profile in a colorectal cancer cohort. World J Gastroenterol 2019; 25(4): 433-446
- URL: https://www.wjgnet.com/1007-9327/full/v25/i4/433.htm
- DOI: https://dx.doi.org/10.3748/wjg.v25.i4.433


