Copyright
©The Author(s) 2019.
World J Gastroenterol. Jan 28, 2019; 25(4): 433-446
Published online Jan 28, 2019. doi: 10.3748/wjg.v25.i4.433
Published online Jan 28, 2019. doi: 10.3748/wjg.v25.i4.433
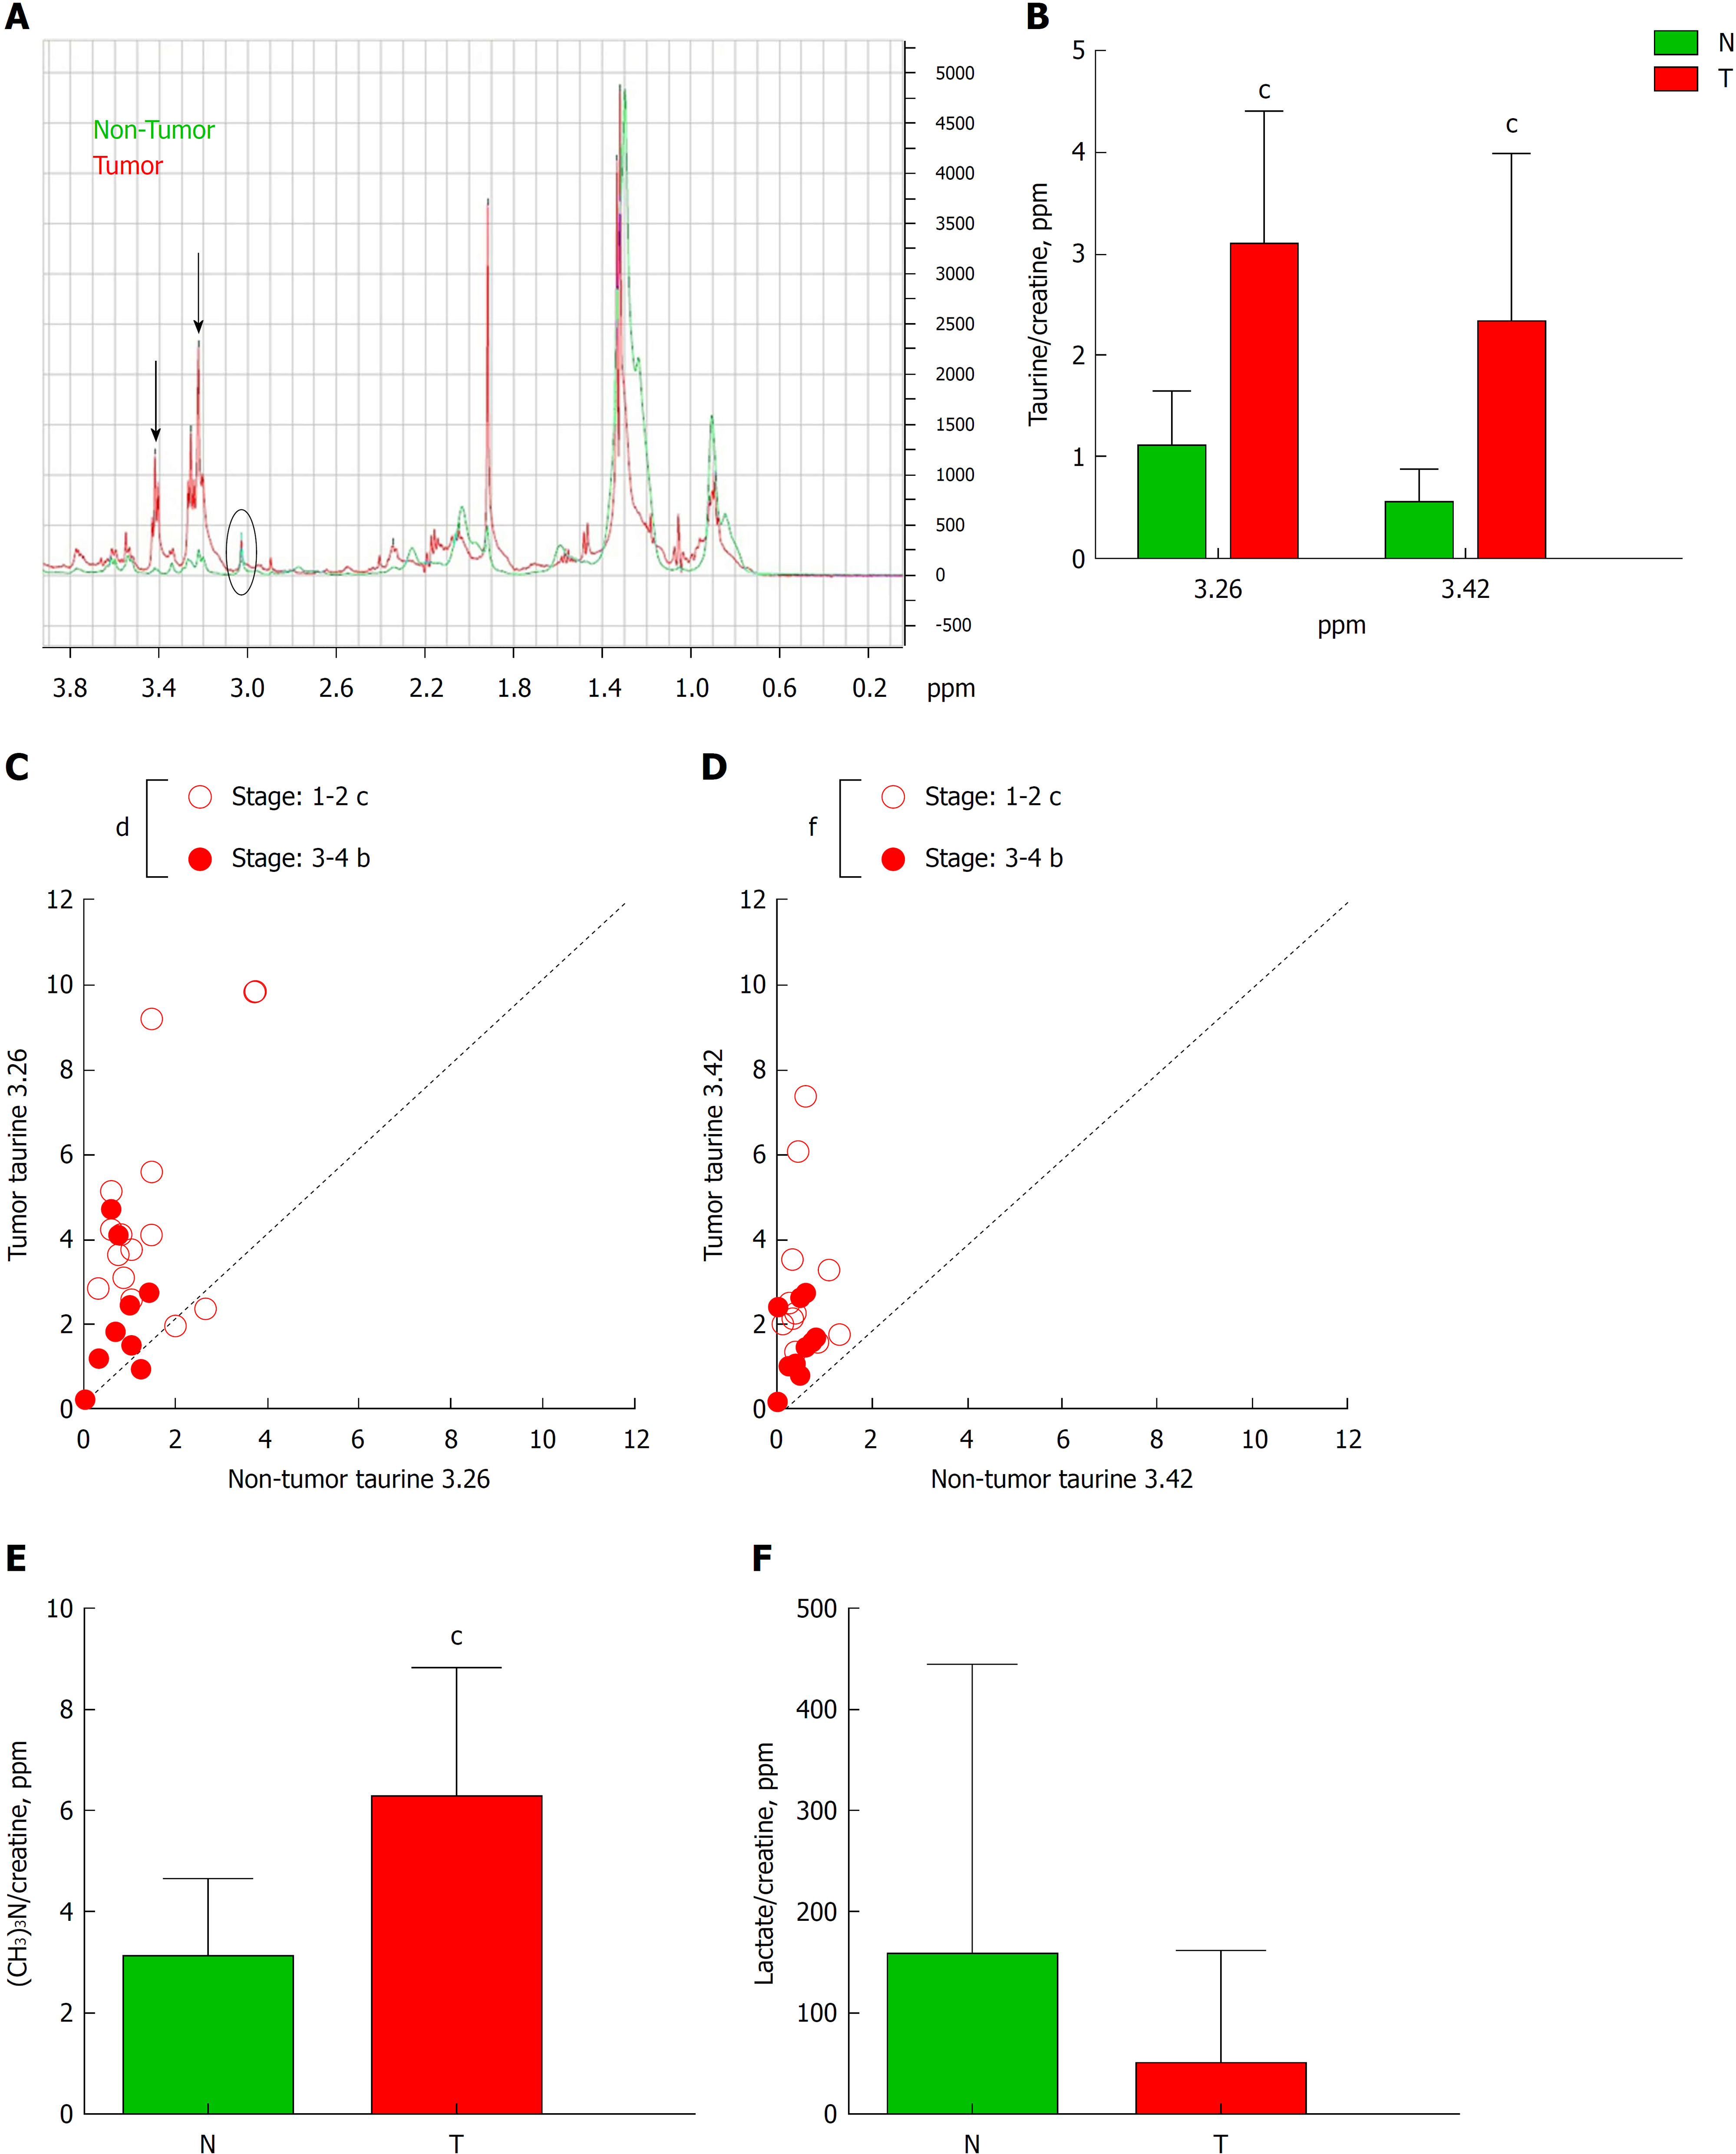
Figure 3 High resolution magic angle spinning analysis of tumor tissue.
A: Schematic diagram of high resolution magic angle spinning spectra of tumor tissue (red line) and non-tumor tissue (blue line). Black arrows indicate two peaks corresponding to taurine δ ppm 3.26 and 3.42. B: Graph represents the quantification of both taurines normalized by creatine of tumor (T) and non-tumor (N) tissue. C and D: Correlation graphs of taurine 3.26 (C) and taurine 3.42 (D) in T vs N subdivided depending on the stage of the Tumor: 1-2 vs 3-4. E and F: Graphs represent the quantification of phosphocholine (E) or lactate (F) in T vs N. n = 29. Graphs show mean ± SD. bP ≤ 0.01, cP ≤ 0.001 of T vs N and dP ≤ 0.05, fP ≤ 0.001 between stages in tumors. T: Tumor; N: Non-tumor.
- Citation: Prieto P, Jaén RI, Calle D, Gómez-Serrano M, Núñez E, Fernández-Velasco M, Martín-Sanz P, Alonso S, Vázquez J, Cerdán S, Peinado MÁ, Boscá L. Interplay between post-translational cyclooxygenase-2 modifications and the metabolic and proteomic profile in a colorectal cancer cohort. World J Gastroenterol 2019; 25(4): 433-446
- URL: https://www.wjgnet.com/1007-9327/full/v25/i4/433.htm
- DOI: https://dx.doi.org/10.3748/wjg.v25.i4.433


