Copyright
©The Author(s) 2019.
World J Gastroenterol. Jan 28, 2019; 25(4): 433-446
Published online Jan 28, 2019. doi: 10.3748/wjg.v25.i4.433
Published online Jan 28, 2019. doi: 10.3748/wjg.v25.i4.433
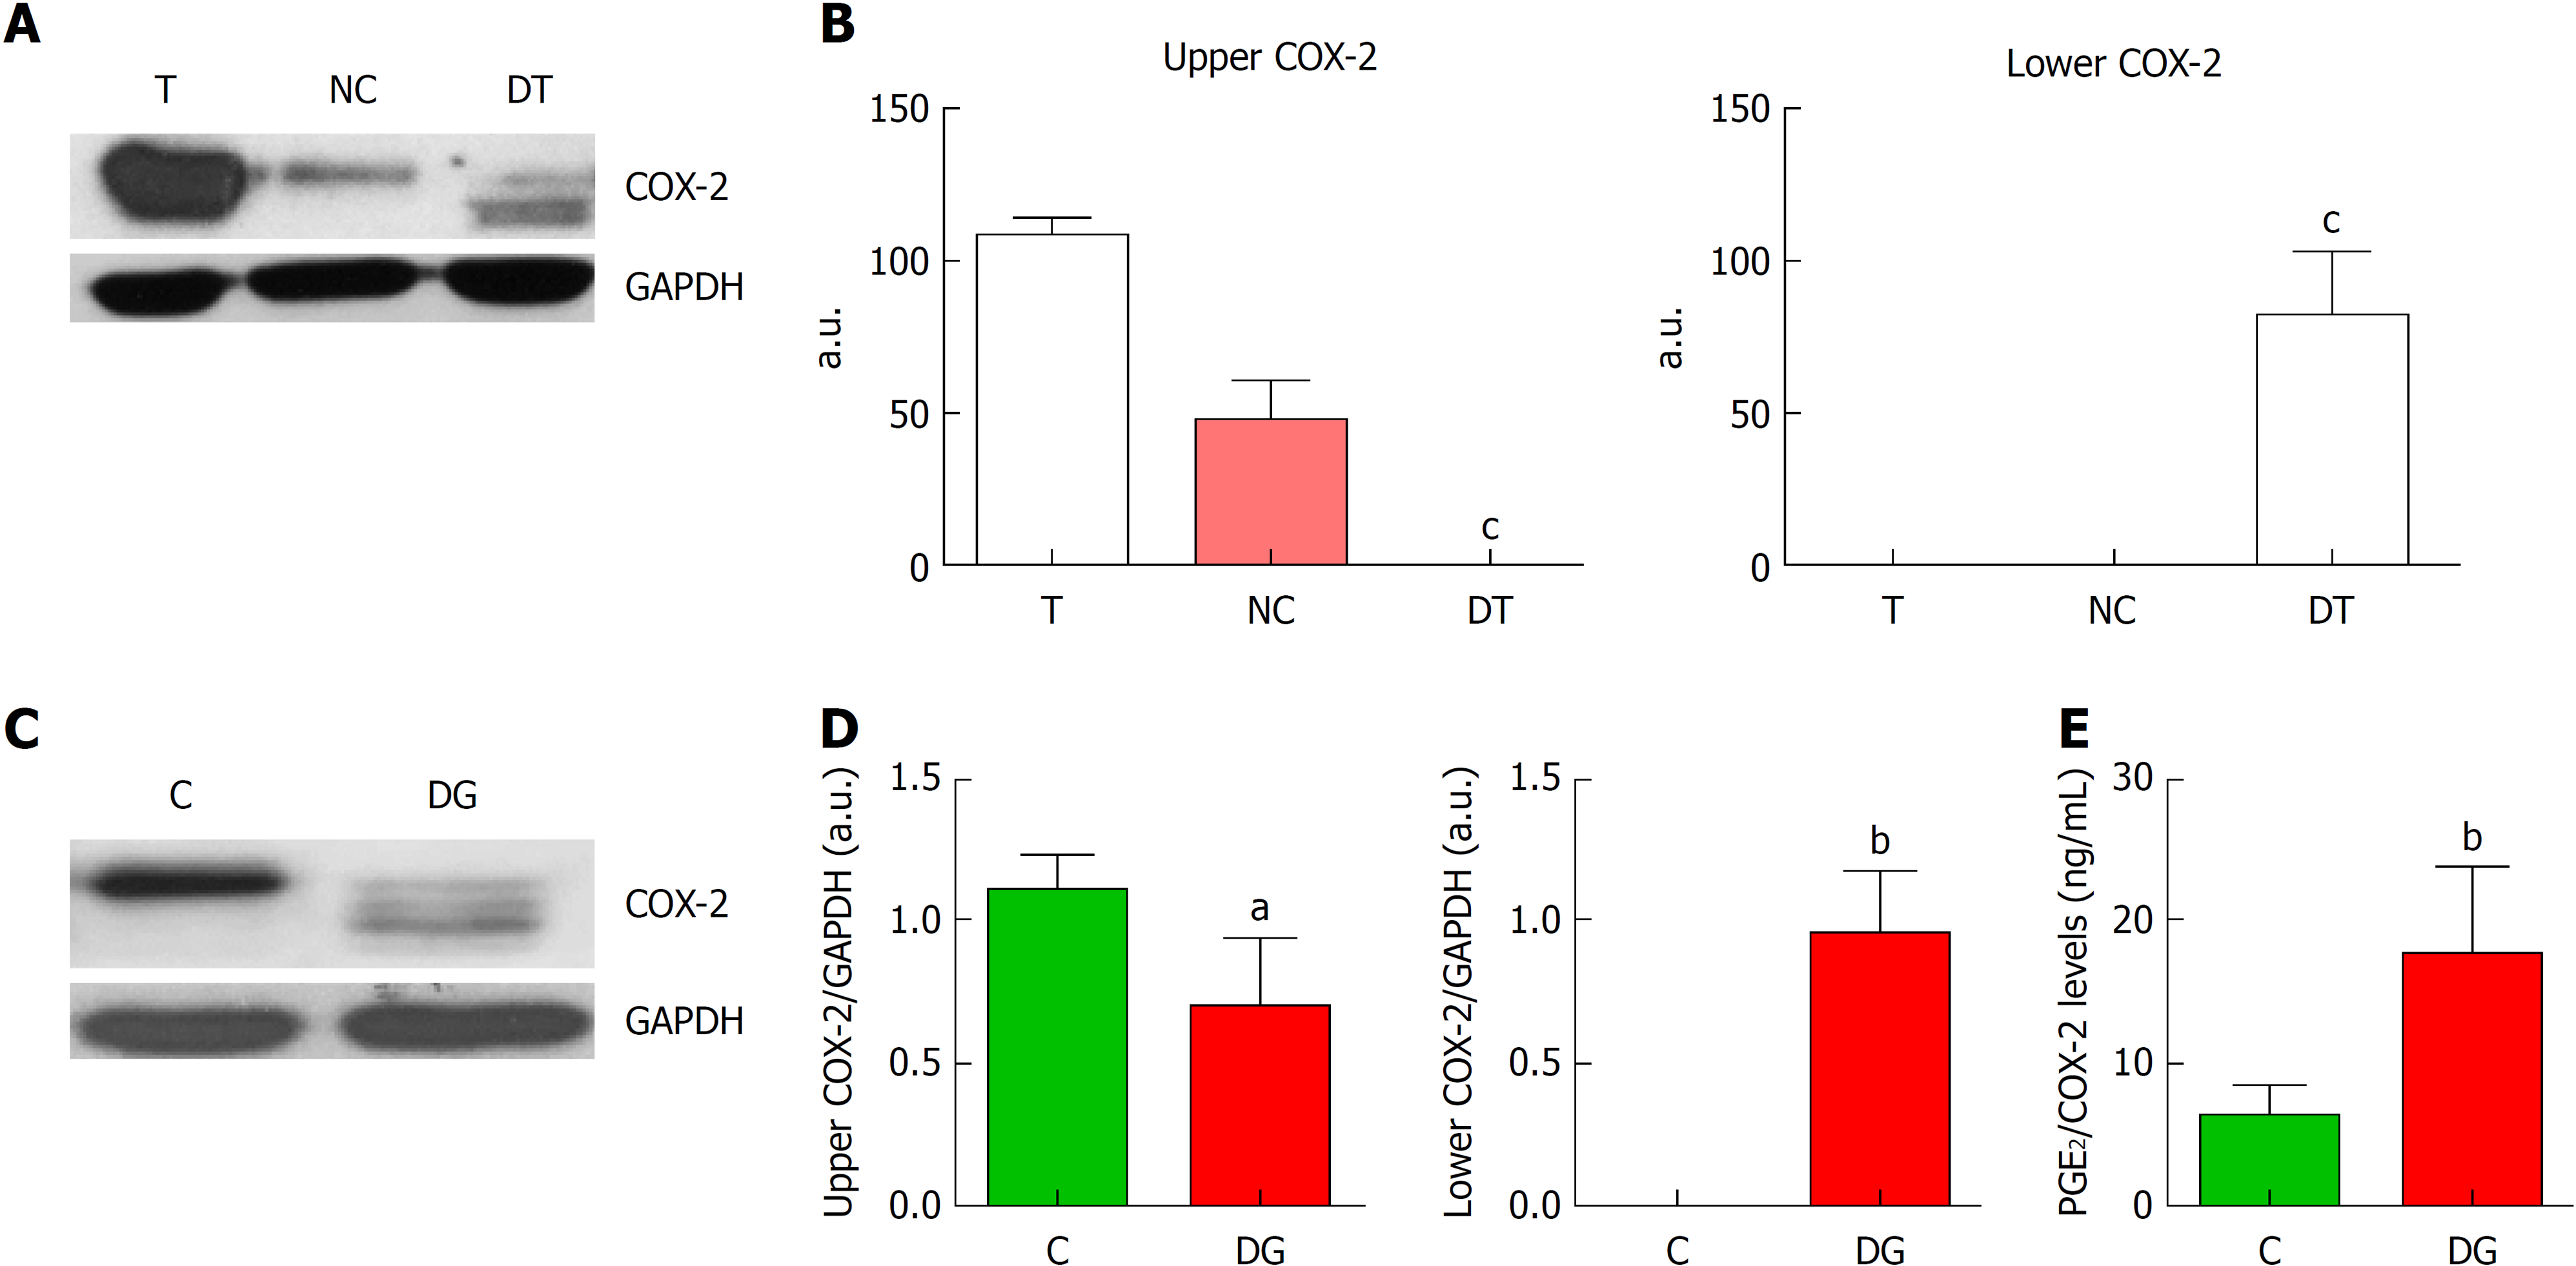
Figure 2 Deglycosylation assays of cyclooxygenase-2.
A: Representative images of western blot of cyclooxygenase-2 (COX-2) protein levels corresponding to tumor tissue (T), negative control (NC) and deglycosylated tumor tissue (DT). B: Graphs correspond to upper or lower COX-2 bands quantifications. n = 4. C: Representative images of western blot of COX-2 protein levels in HT29 cells under basal conditions (C) or deglycosylated (DG). D: Graphs correspond to upper or lower COX-2 bands quantifications. n = 8. E. Relative levels of prostaglandin E2 (PGE2) normalized by total COX-2 band obtained in the corresponding western blot analysis. n = 11. Graphs show mean ± SD. aP ≤ 0.05, bP ≤ 0.01 and cP ≤ 0.001 vs the glycosylated condition. COX-2: Cyclooxygenase-2; T: Tumor; NC: Negative control; DT: Deglycosylated tumor; C: Cells under basal conditions; DG: Deglycosylated; PGE2: Prostaglandin E2.
- Citation: Prieto P, Jaén RI, Calle D, Gómez-Serrano M, Núñez E, Fernández-Velasco M, Martín-Sanz P, Alonso S, Vázquez J, Cerdán S, Peinado MÁ, Boscá L. Interplay between post-translational cyclooxygenase-2 modifications and the metabolic and proteomic profile in a colorectal cancer cohort. World J Gastroenterol 2019; 25(4): 433-446
- URL: https://www.wjgnet.com/1007-9327/full/v25/i4/433.htm
- DOI: https://dx.doi.org/10.3748/wjg.v25.i4.433


