Copyright
©The Author(s) 2019.
World J Gastroenterol. Oct 14, 2019; 25(38): 5838-5849
Published online Oct 14, 2019. doi: 10.3748/wjg.v25.i38.5838
Published online Oct 14, 2019. doi: 10.3748/wjg.v25.i38.5838
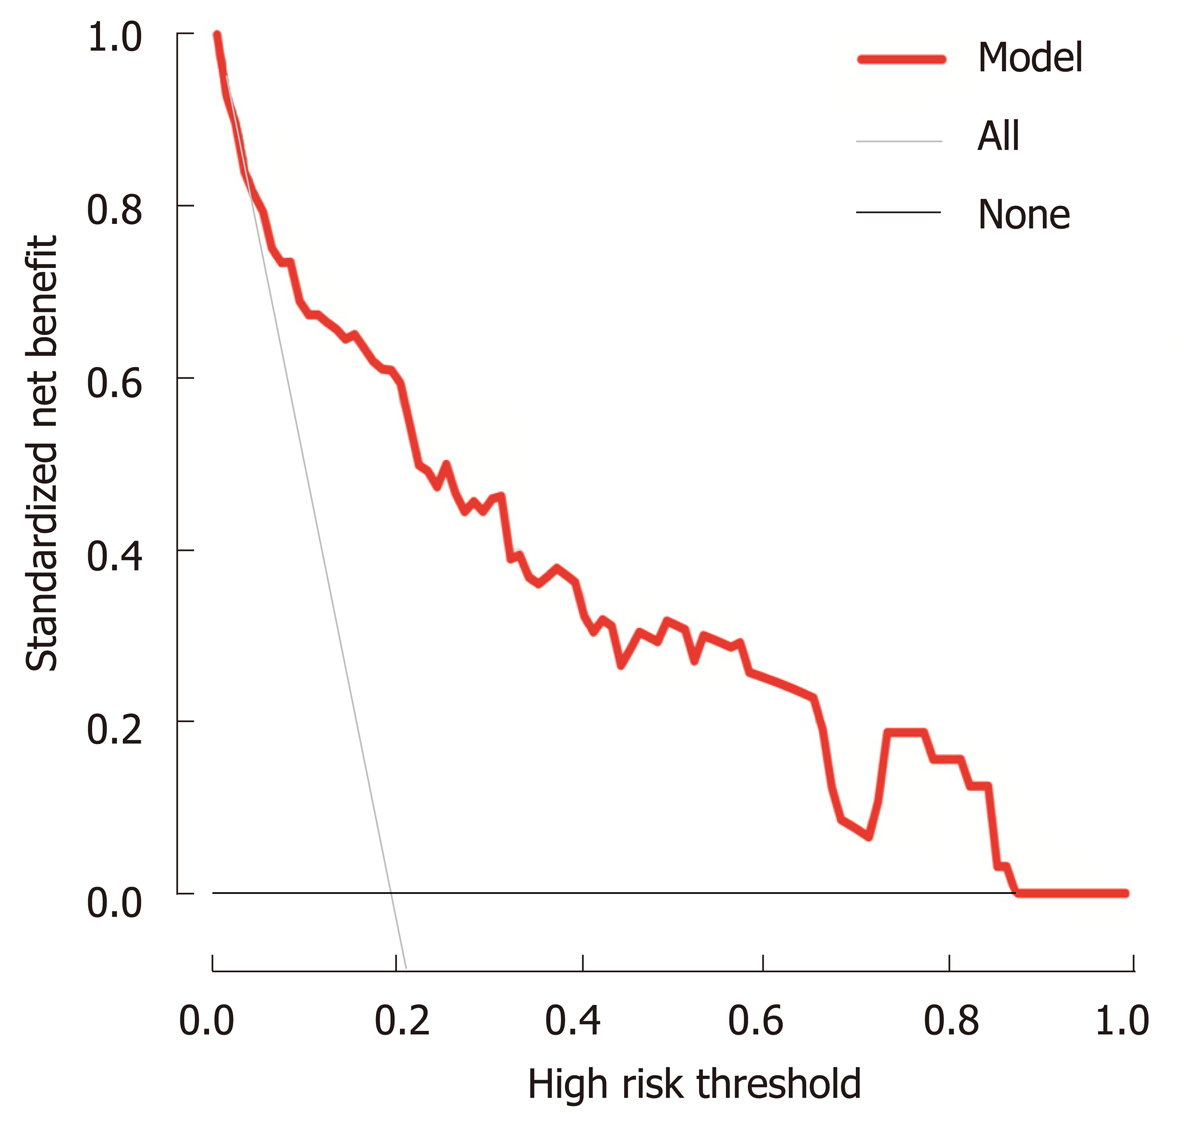
Figure 5 Decision curve analysis for the prediction model.
Red solid line: Prediction model. Tin slash line: Assume all patients have PPOI. Solid horizontal line: Assume no patients have PPOI. The graph indicates the expected net benefit per patient relative to the nomogram prediction of PPOI. PPOI: Prolonged postoperative ileus.
- Citation: Liang WQ, Zhang KC, Cui JX, Xi HQ, Cai AZ, Li JY, Liu YH, Liu J, Zhang W, Wang PP, Wei B, Chen L. Nomogram to predict prolonged postoperative ileus after gastrectomy in gastric cancer. World J Gastroenterol 2019; 25(38): 5838-5849
- URL: https://www.wjgnet.com/1007-9327/full/v25/i38/5838.htm
- DOI: https://dx.doi.org/10.3748/wjg.v25.i38.5838


