Copyright
©The Author(s) 2019.
World J Gastroenterol. Oct 14, 2019; 25(38): 5838-5849
Published online Oct 14, 2019. doi: 10.3748/wjg.v25.i38.5838
Published online Oct 14, 2019. doi: 10.3748/wjg.v25.i38.5838
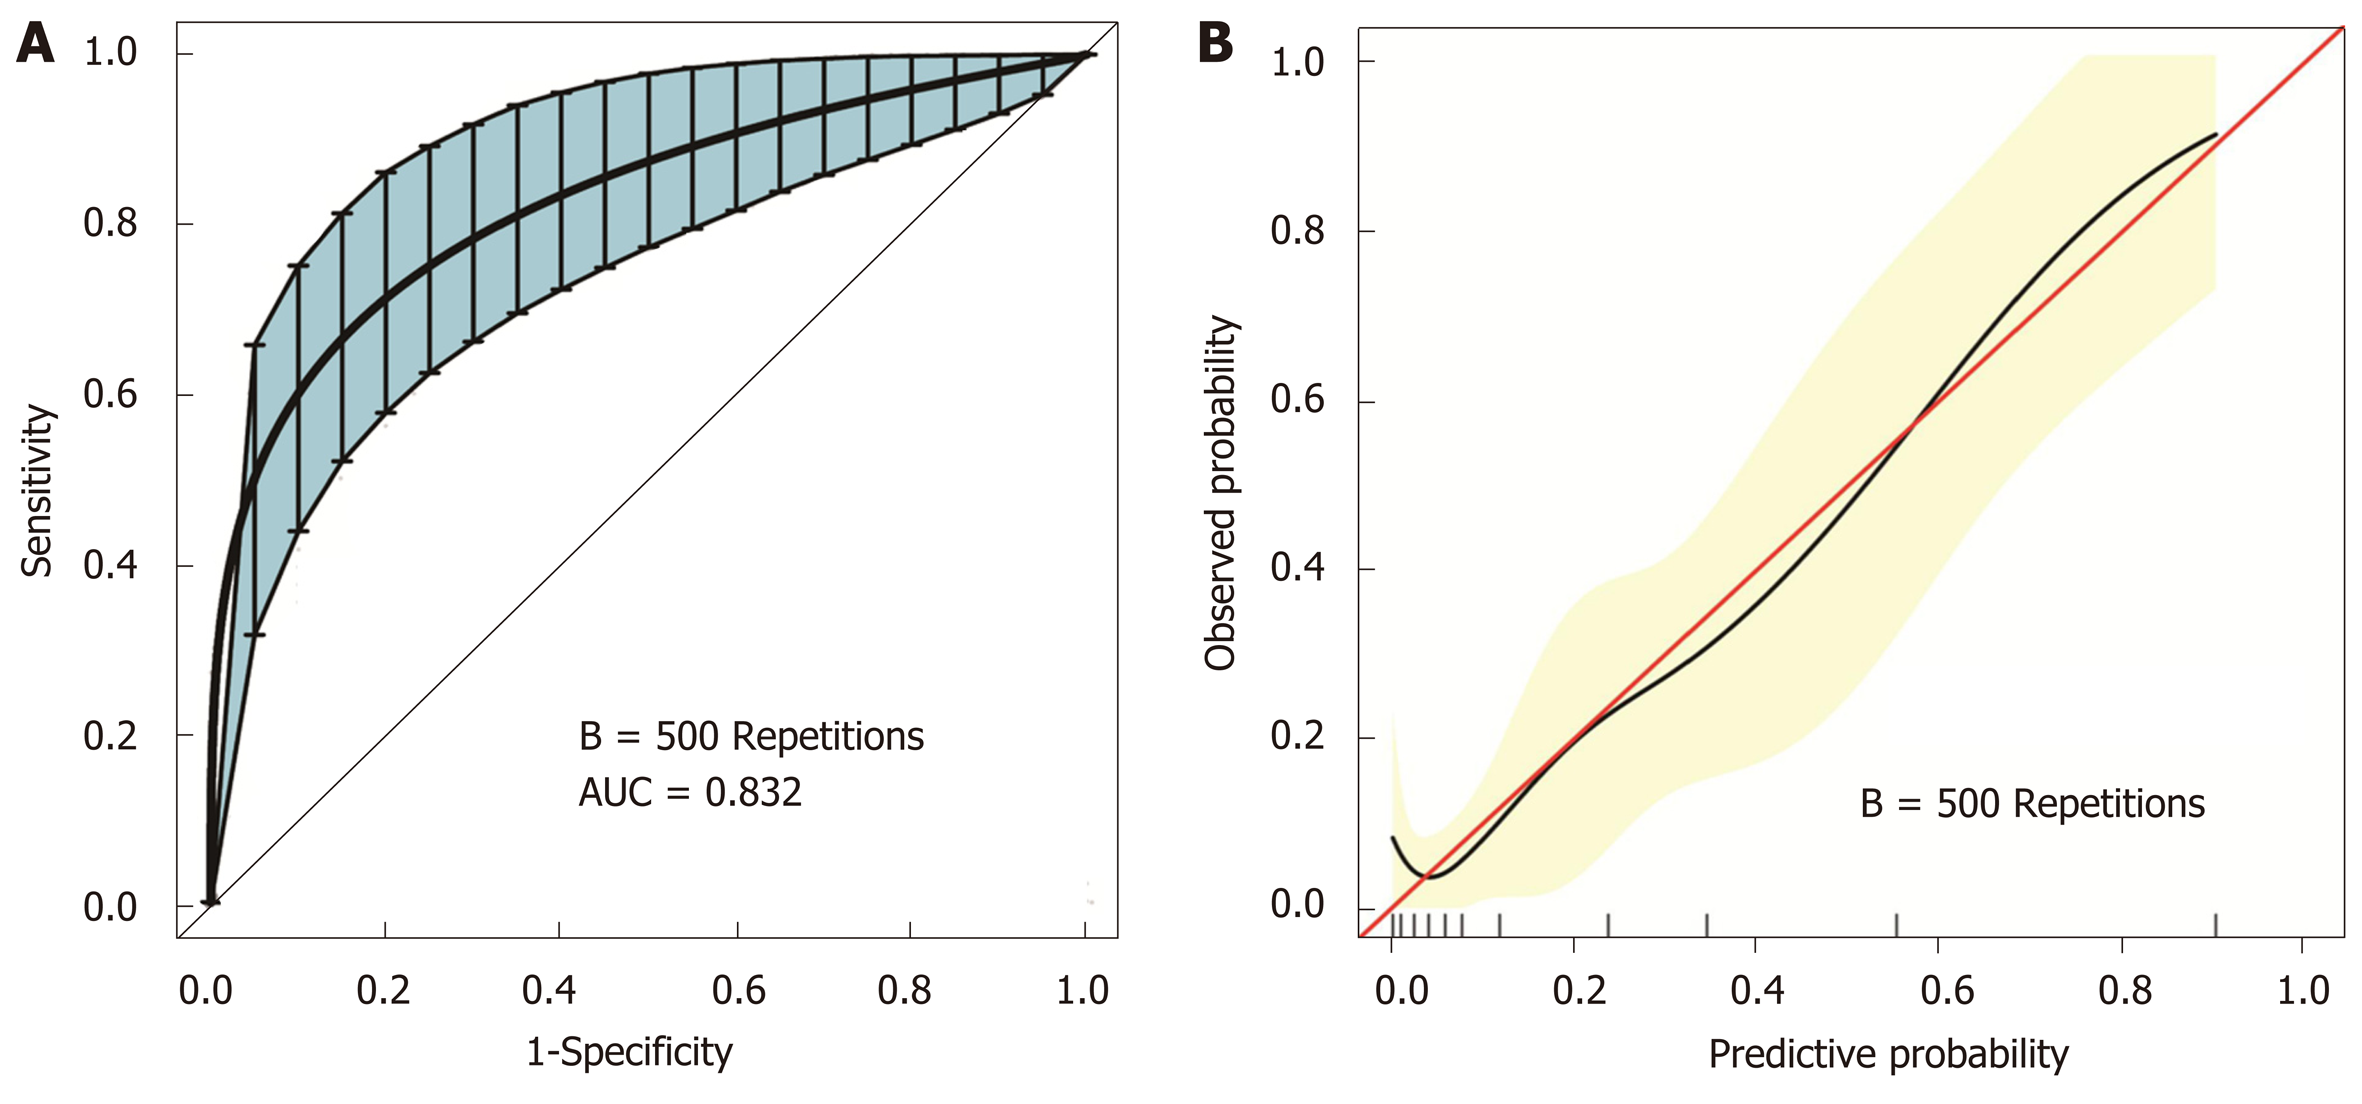
Figure 4 Internal validation of the nomogram using the bootstrap sampling.
A: The ROC curve was measured by bootstrapping for 500 repetitions, and the AUC of the bootstrap stepwise model was showed; B: Calibration curve for predicted probability of the PPOI nomogram. The X axis is the predicted probability of the nomogram, and the Y axis is the observed probability. The red line shows the ideal calibration line, while the yellow area shows the 95% confidence interval of the prediction model. AUC: Area under the receiver operating characteristic curve; ROC: Receiver operating characteristic; PPOI: Prolonged postoperative ileus.
- Citation: Liang WQ, Zhang KC, Cui JX, Xi HQ, Cai AZ, Li JY, Liu YH, Liu J, Zhang W, Wang PP, Wei B, Chen L. Nomogram to predict prolonged postoperative ileus after gastrectomy in gastric cancer. World J Gastroenterol 2019; 25(38): 5838-5849
- URL: https://www.wjgnet.com/1007-9327/full/v25/i38/5838.htm
- DOI: https://dx.doi.org/10.3748/wjg.v25.i38.5838


