Copyright
©The Author(s) 2019.
World J Gastroenterol. Sep 28, 2019; 25(36): 5569-5577
Published online Sep 28, 2019. doi: 10.3748/wjg.v25.i36.5569
Published online Sep 28, 2019. doi: 10.3748/wjg.v25.i36.5569
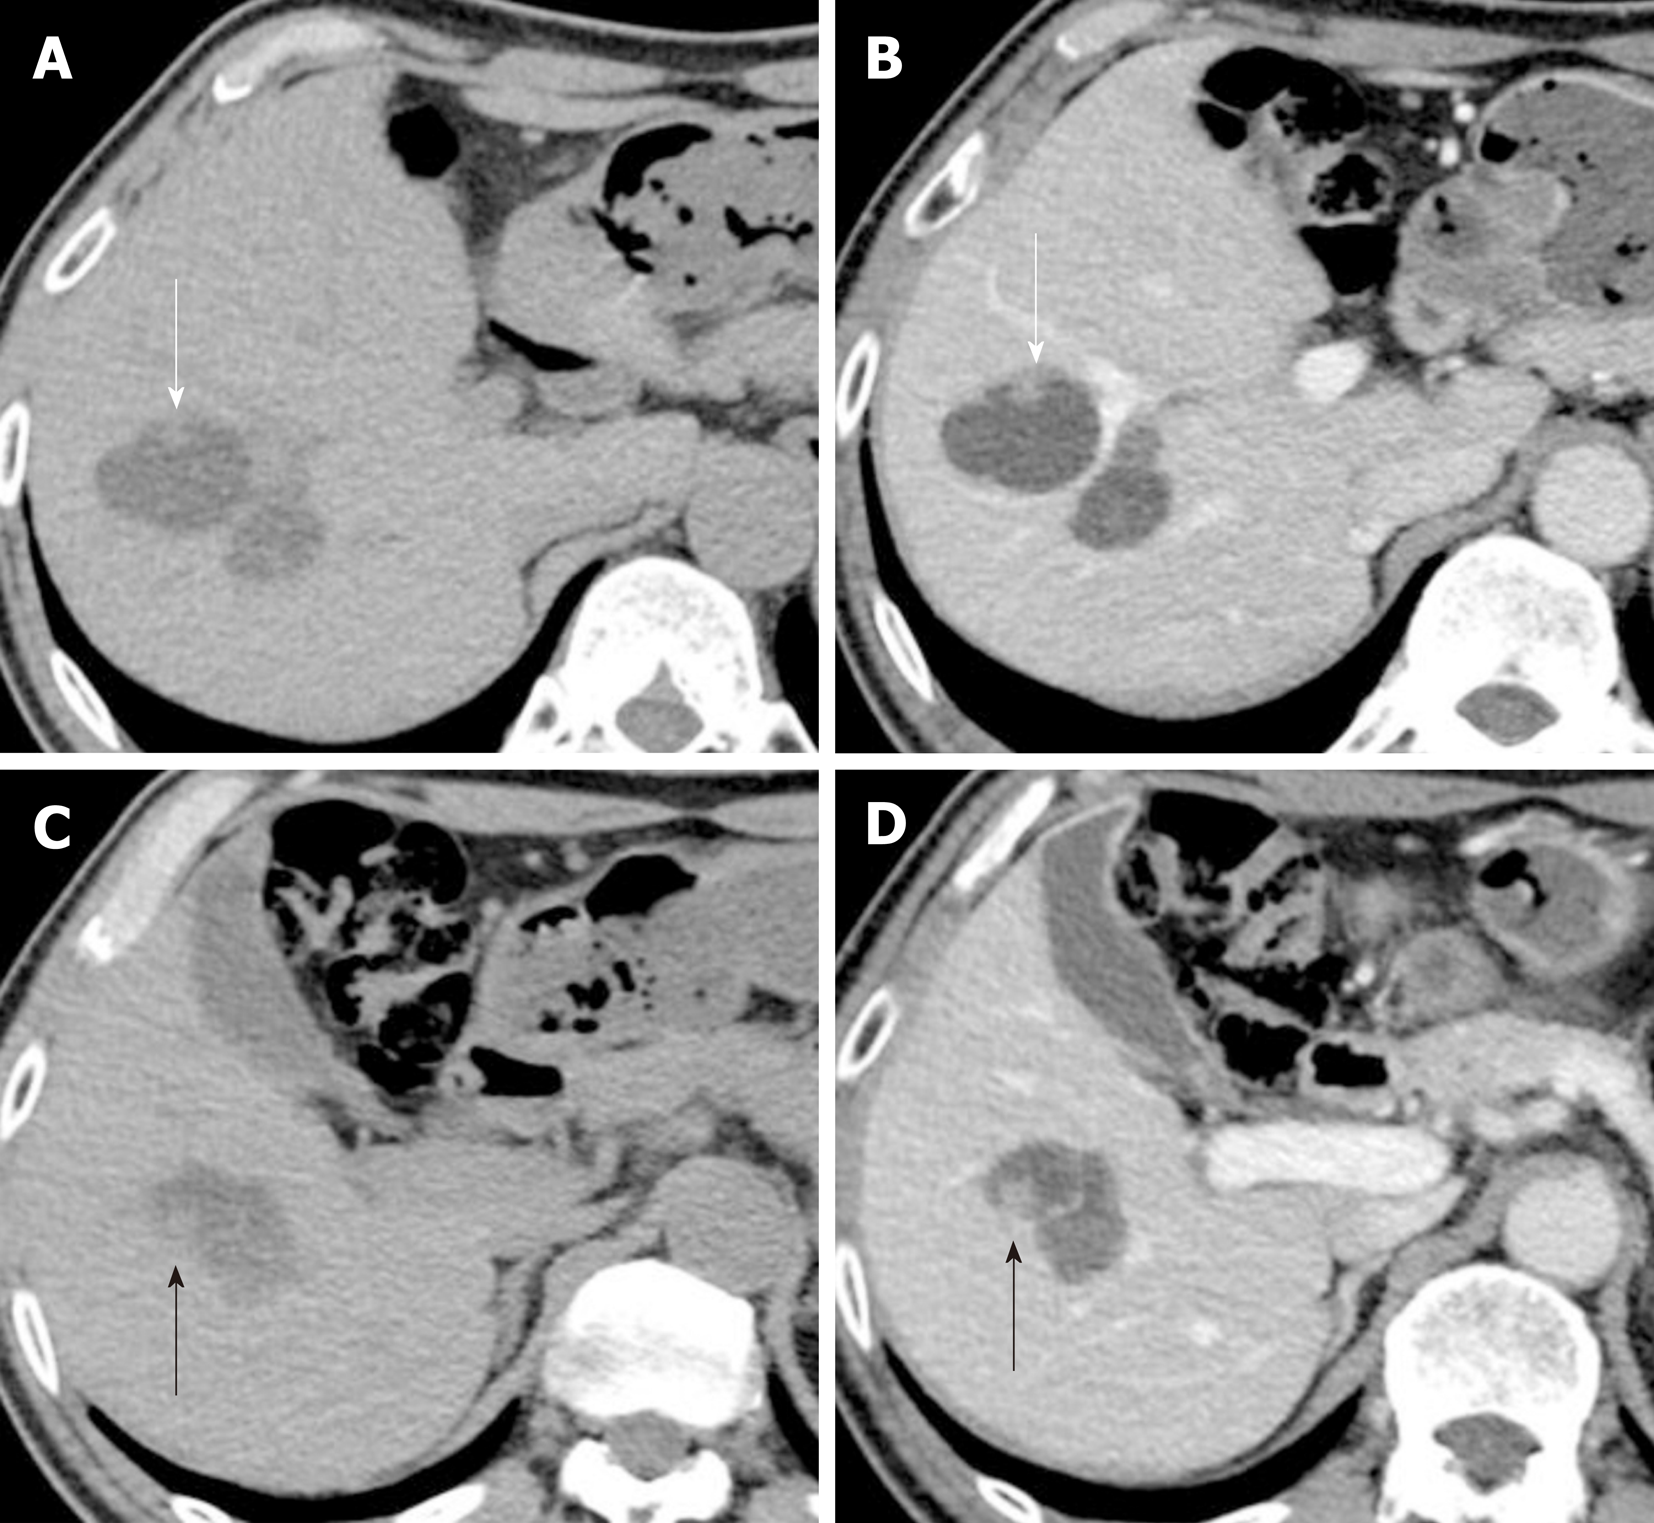
Figure 3 Computed tomography performed 13 years after the initial clinical visit.
A and C: Plain computed tomography (CT) shows the 33 mm anterior tumor and the 32 mm posterior tumor. Two papillary proliferations are observed on the surface of the anterior tumor [8 mm on the anterior surface (A; white arrow) and 9 mm on the posterior surface (C; black arrow)]. B and D: Portal-phase CT shows slight hyperenhancement of the tumor surface and the papillary proliferation. CT: Computed tomography.
- Citation: Hasebe T, Sawada K, Hayashi H, Nakajima S, Takahashi H, Hagiwara M, Imai K, Yuzawa S, Fujiya M, Furukawa H, Okumura T. Long-term growth of intrahepatic papillary neoplasms: A case report. World J Gastroenterol 2019; 25(36): 5569-5577
- URL: https://www.wjgnet.com/1007-9327/full/v25/i36/5569.htm
- DOI: https://dx.doi.org/10.3748/wjg.v25.i36.5569


