Copyright
©The Author(s) 2019.
World J Gastroenterol. Sep 28, 2019; 25(36): 5543-5558
Published online Sep 28, 2019. doi: 10.3748/wjg.v25.i36.5543
Published online Sep 28, 2019. doi: 10.3748/wjg.v25.i36.5543
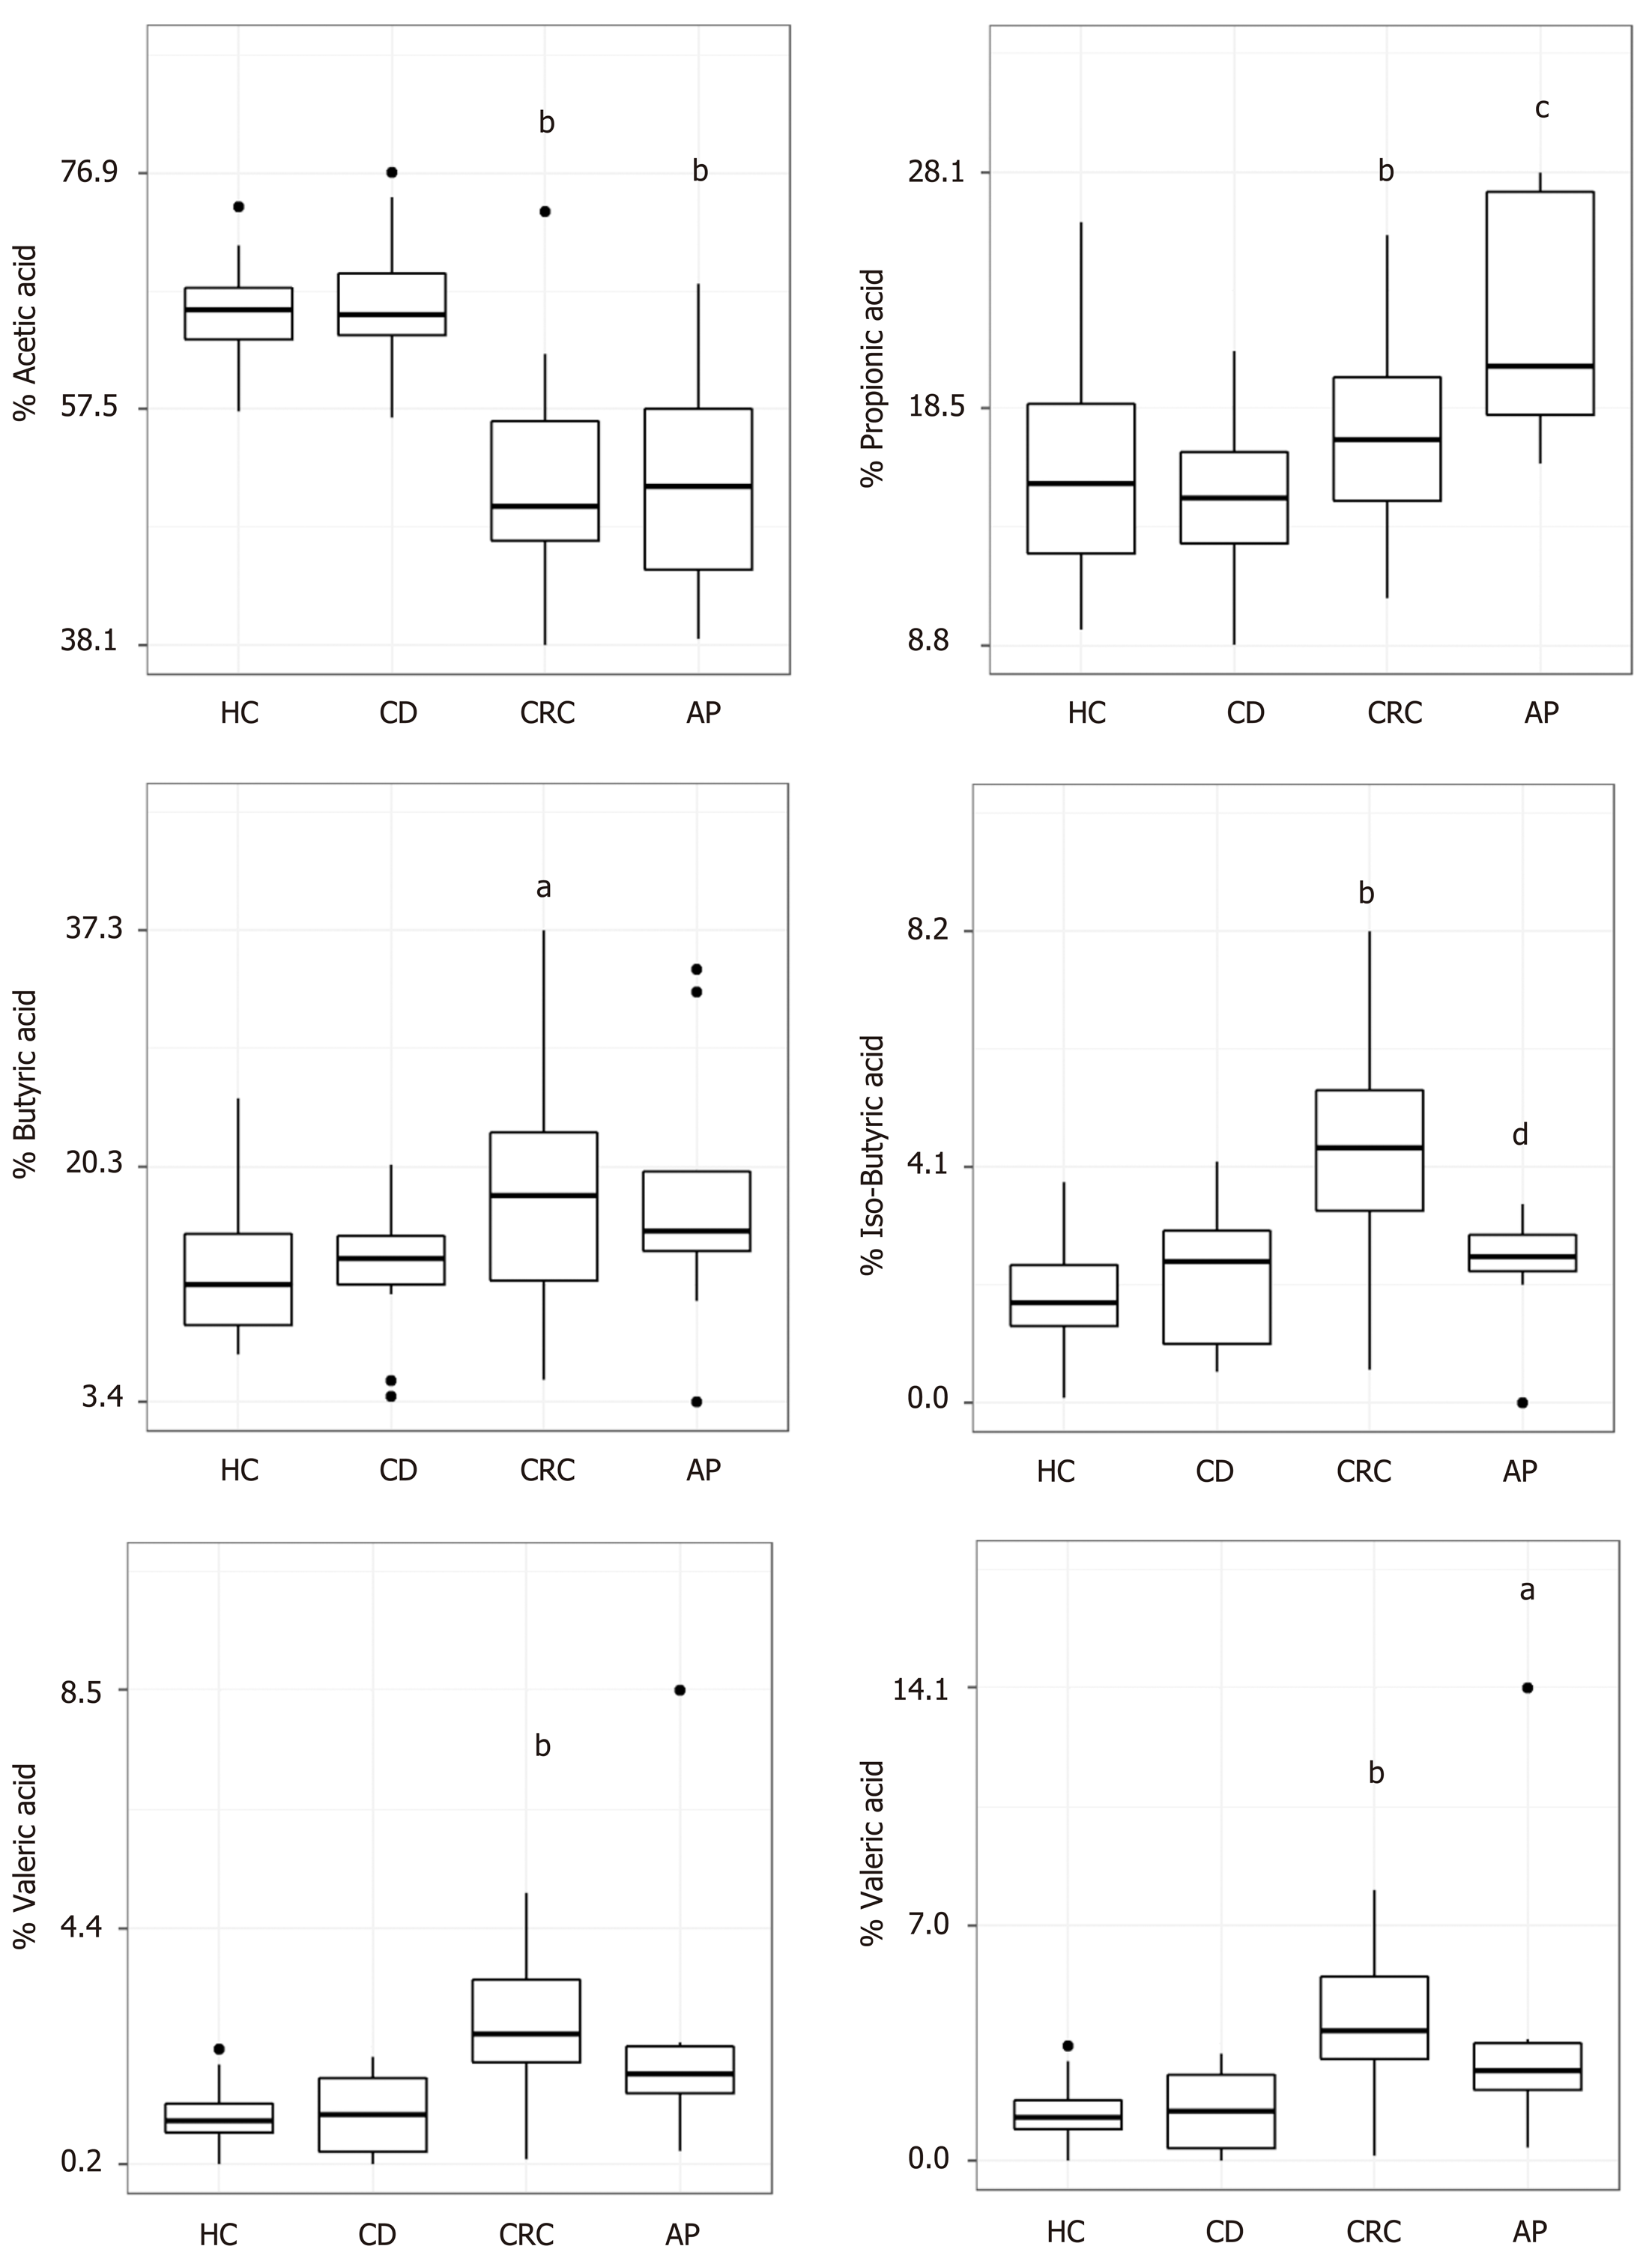
Figure 2 Representation of each short chain fatty acid percentage in celiac disease, colorectal cancer, adenomatous polyposis patients and healthy controls.
The differences between States were assessed using the Wilcoxon test. aP < 0.05 vs HC, bP < 0.01 vs HC, cP < 0.05 vs CRC and dP < 0.01 vs CRC.
- Citation: Niccolai E, Baldi S, Ricci F, Russo E, Nannini G, Menicatti M, Poli G, Taddei A, Bartolucci G, Calabrò AS, Stingo FC, Amedei A. Evaluation and comparison of short chain fatty acids composition in gut diseases. World J Gastroenterol 2019; 25(36): 5543-5558
- URL: https://www.wjgnet.com/1007-9327/full/v25/i36/5543.htm
- DOI: https://dx.doi.org/10.3748/wjg.v25.i36.5543


