Copyright
©The Author(s) 2019.
World J Gastroenterol. Sep 28, 2019; 25(36): 5434-5450
Published online Sep 28, 2019. doi: 10.3748/wjg.v25.i36.5434
Published online Sep 28, 2019. doi: 10.3748/wjg.v25.i36.5434
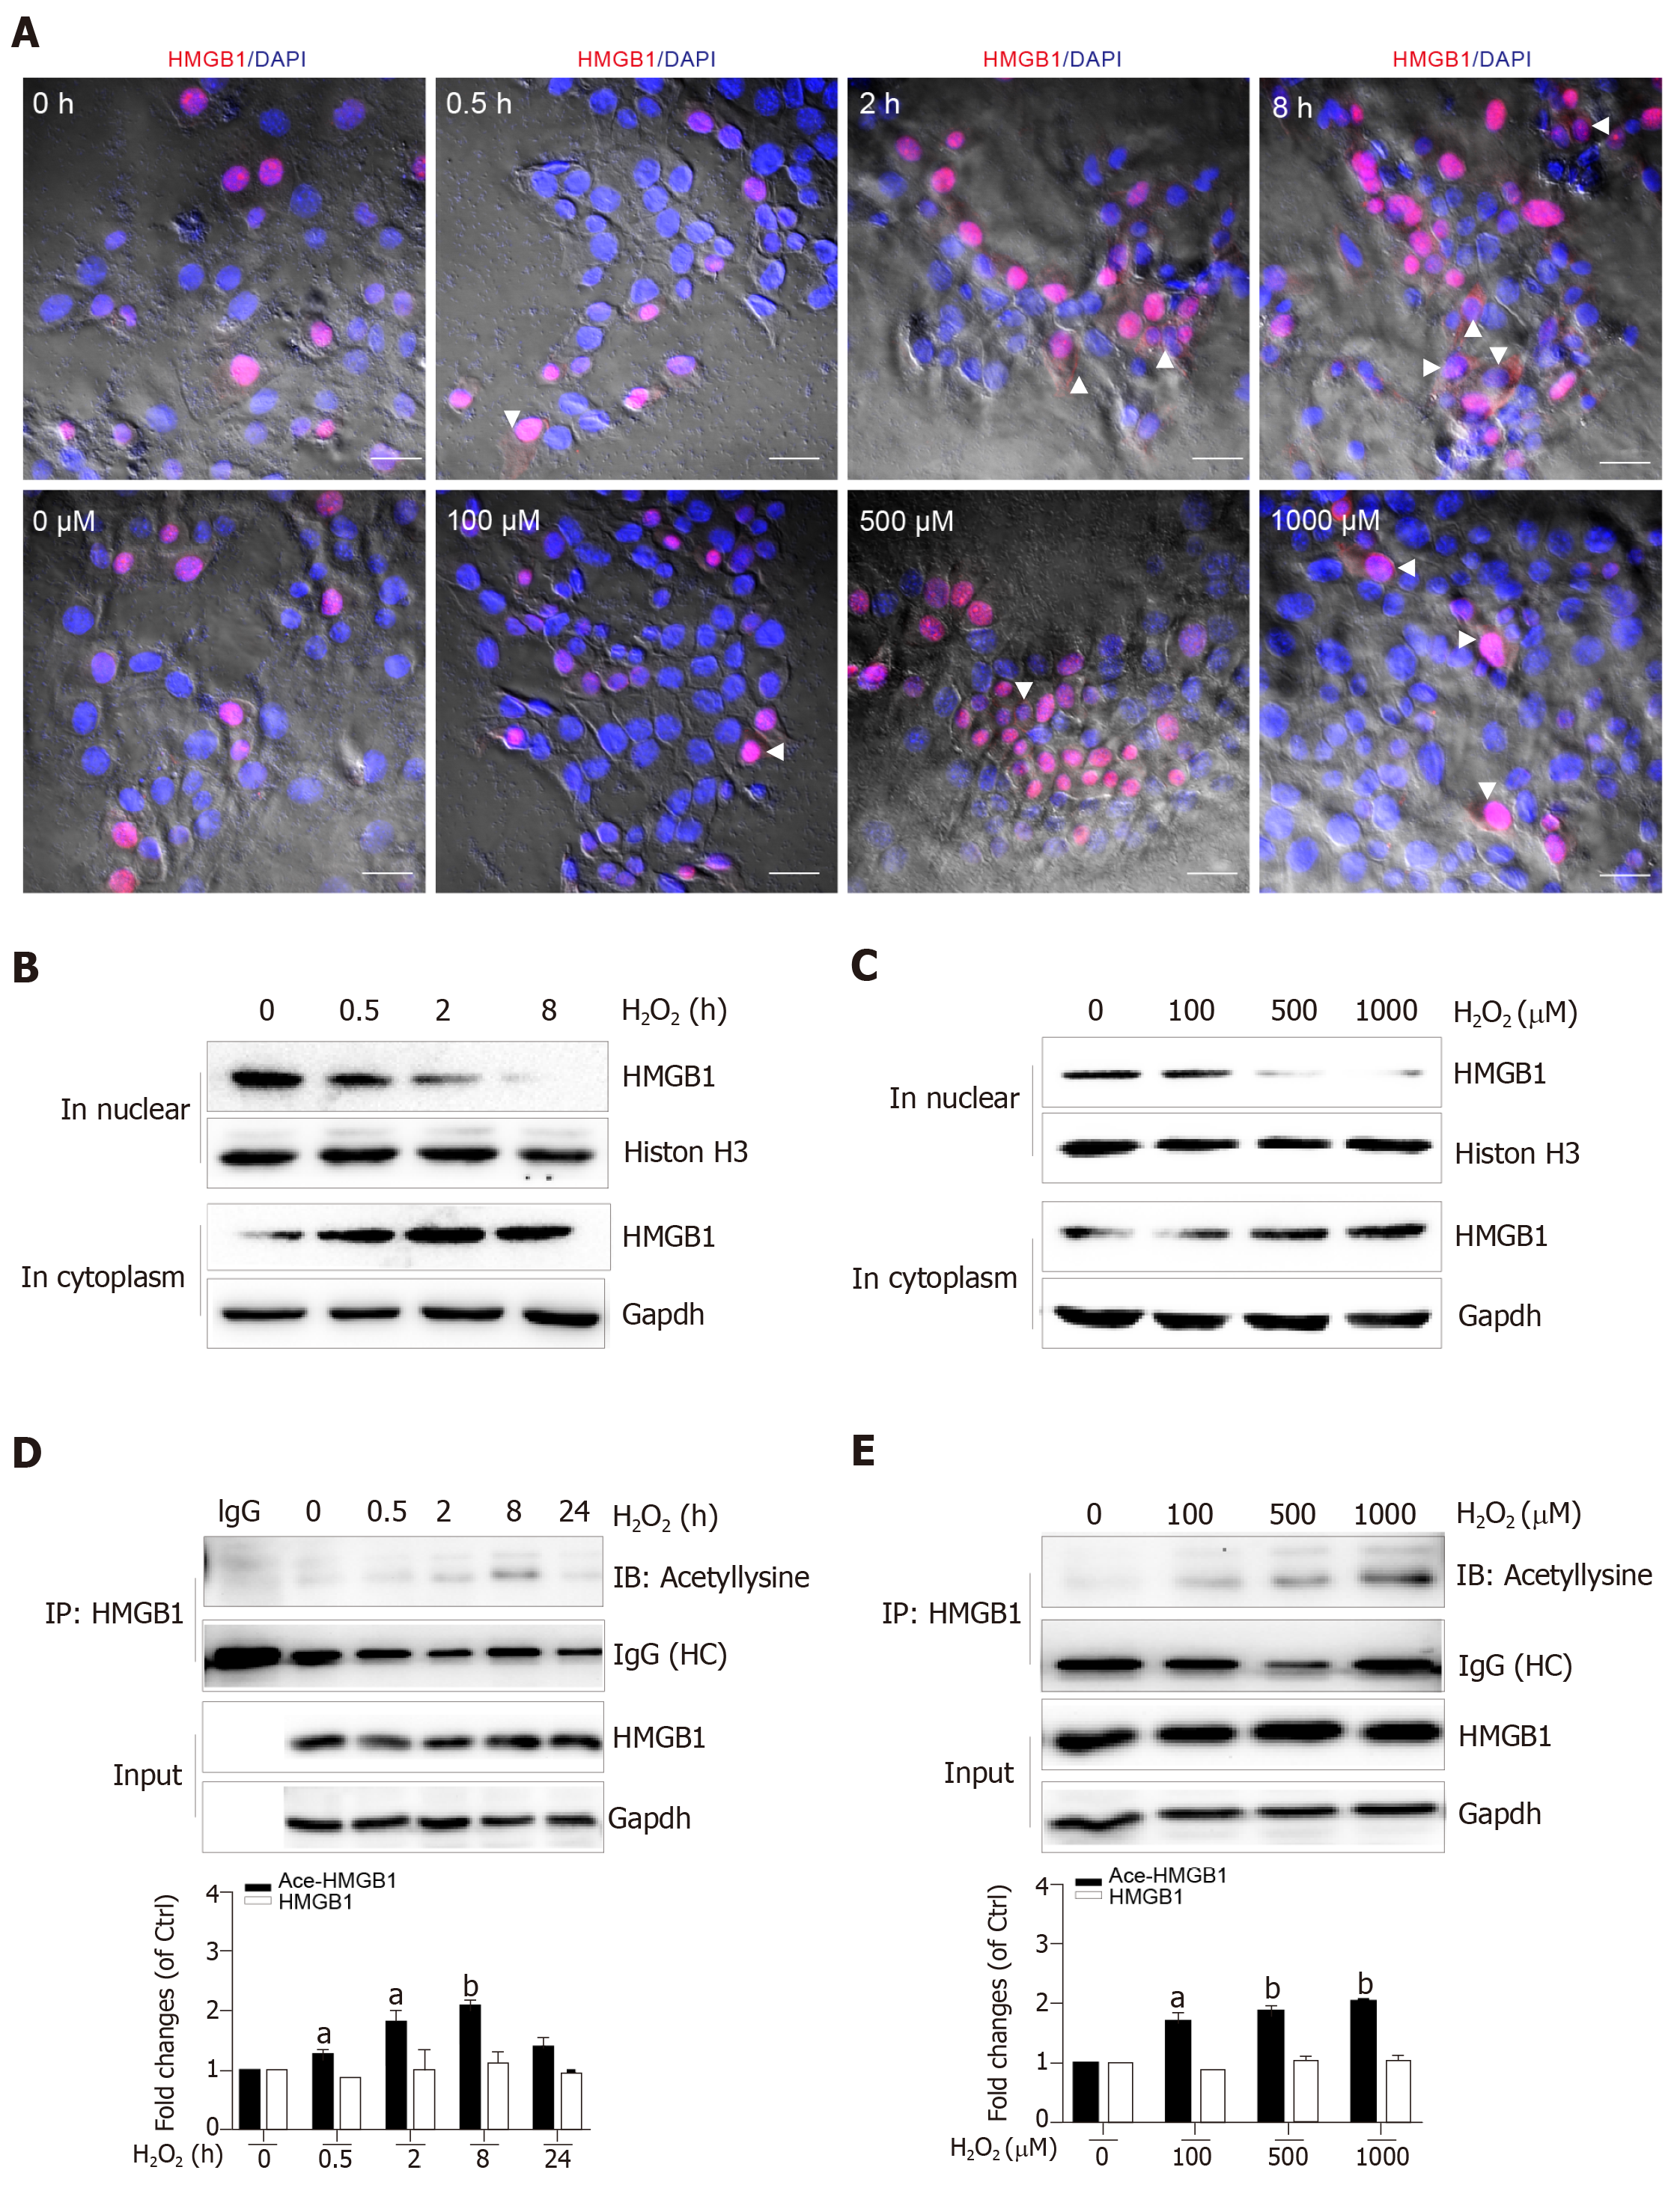
Figure 3 H2O2 induced high mobility group box-1 translocation and acetylation.
A: Confocal microscopy analysis of cells treated with H2O2 either for different durations or at different concentrations. (scale bar = 40 μm). The white arrow shows the translocation of high mobility group box-1 (HMGB1) to the cytoplasm; B and C: HMGB1 expression determined by Western blot; D and E: Acetylated HMGB1 determined by immunoprecipitation. All data are presented as the mean ± SD. Statistical analysis was done by the Student’s t-test. aP < 0.05 vs 0 group, bP < 0.01 vs 0 group. HMGB1: High mobility group box-1.
- Citation: Ye TJ, Lu YL, Yan XF, Hu XD, Wang XL. High mobility group box-1 release from H2O2-injured hepatocytes due to sirt1 functional inhibition. World J Gastroenterol 2019; 25(36): 5434-5450
- URL: https://www.wjgnet.com/1007-9327/full/v25/i36/5434.htm
- DOI: https://dx.doi.org/10.3748/wjg.v25.i36.5434


