Copyright
©The Author(s) 2019.
World J Gastroenterol. Sep 7, 2019; 25(33): 4945-4958
Published online Sep 7, 2019. doi: 10.3748/wjg.v25.i33.4945
Published online Sep 7, 2019. doi: 10.3748/wjg.v25.i33.4945
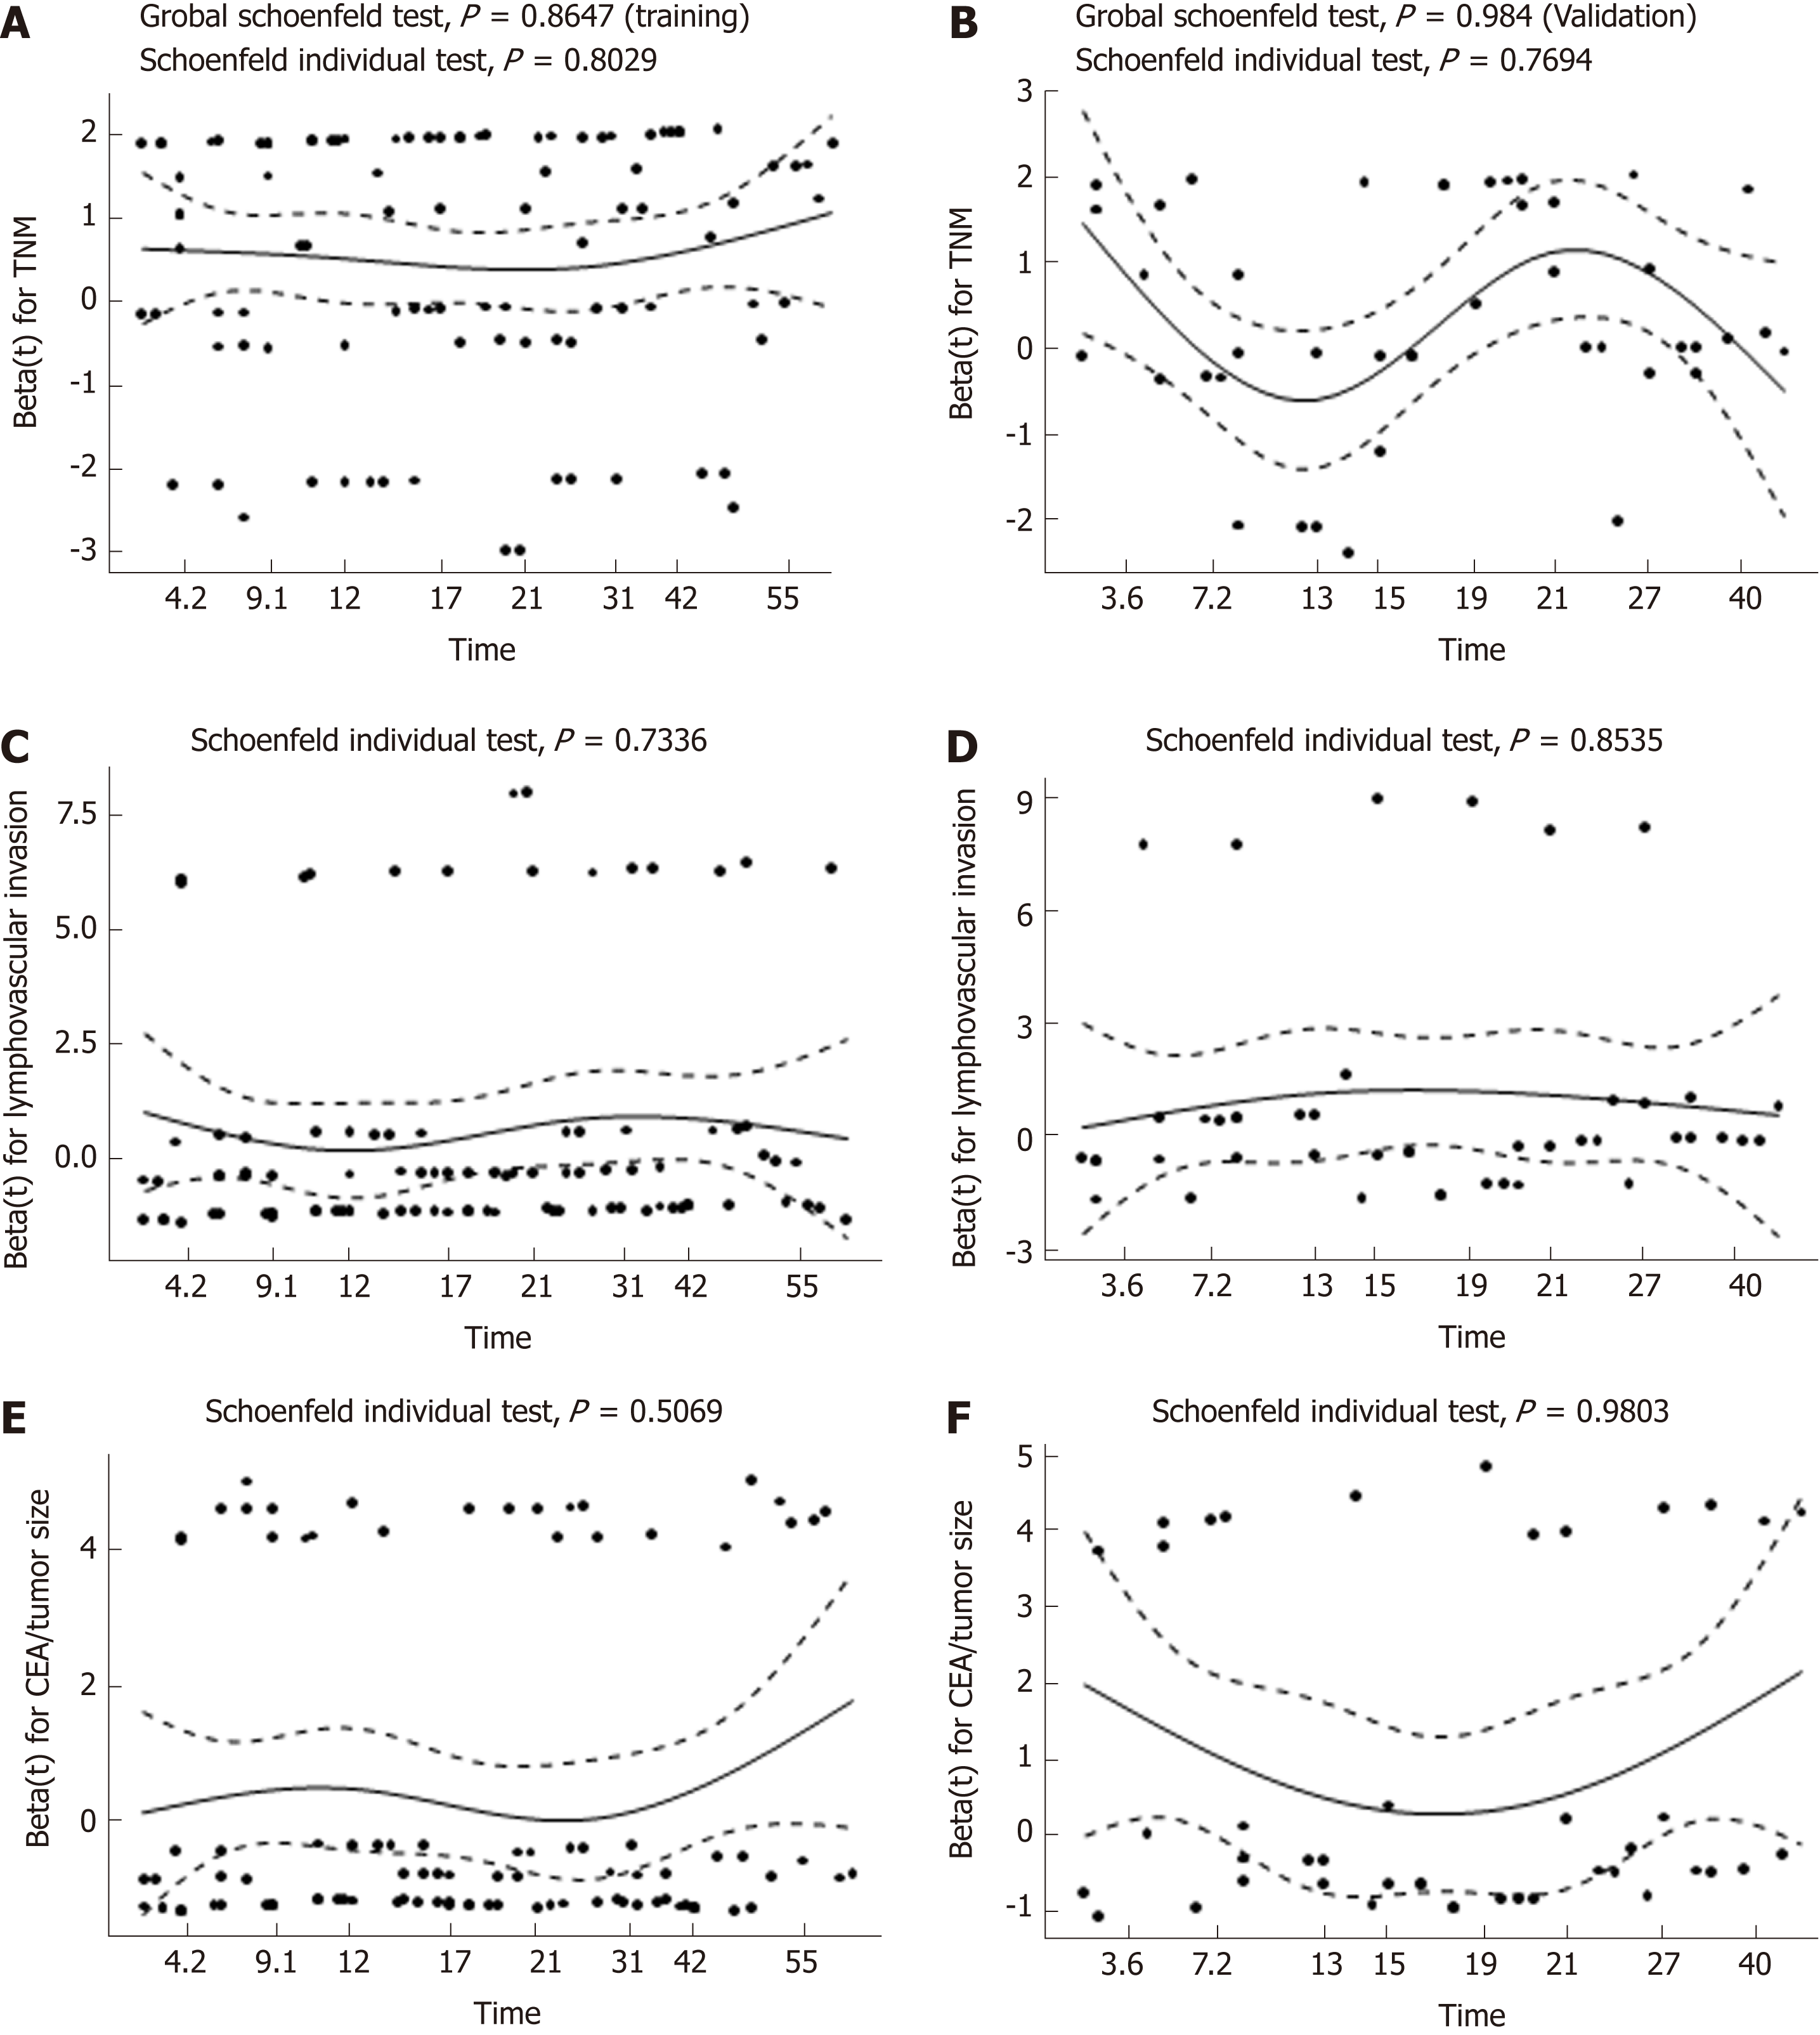
Figure 6 Proportional hazards assumption test for disease-free survival by plotting the Schoenfeld residuals against time in the training cohort (A, C, and E) and the validation cohort (B, D, and F).
The X-axis represents the survival time, while the Beta values referring to TNM stage, lymphovascular invasion, and carcinoembryonic antigen/tumor size are shown on the Y-axis. The constant mean of residuals across time confirms that the proportional hazard assumption holds for these covariate with all of the P-values > 0.05. CEA: Carcinoembryonic antigen.
- Citation: Cai D, Huang ZH, Yu HC, Wang XL, Bai LL, Tang GN, Peng SY, Li YJ, Huang MJ, Cao GW, Wang JP, Luo YX. Prognostic value of preoperative carcinoembryonic antigen/tumor size in rectal cancer. World J Gastroenterol 2019; 25(33): 4945-4958
- URL: https://www.wjgnet.com/1007-9327/full/v25/i33/4945.htm
- DOI: https://dx.doi.org/10.3748/wjg.v25.i33.4945


