Copyright
©The Author(s) 2019.
World J Gastroenterol. Aug 28, 2019; 25(32): 4715-4726
Published online Aug 28, 2019. doi: 10.3748/wjg.v25.i32.4715
Published online Aug 28, 2019. doi: 10.3748/wjg.v25.i32.4715
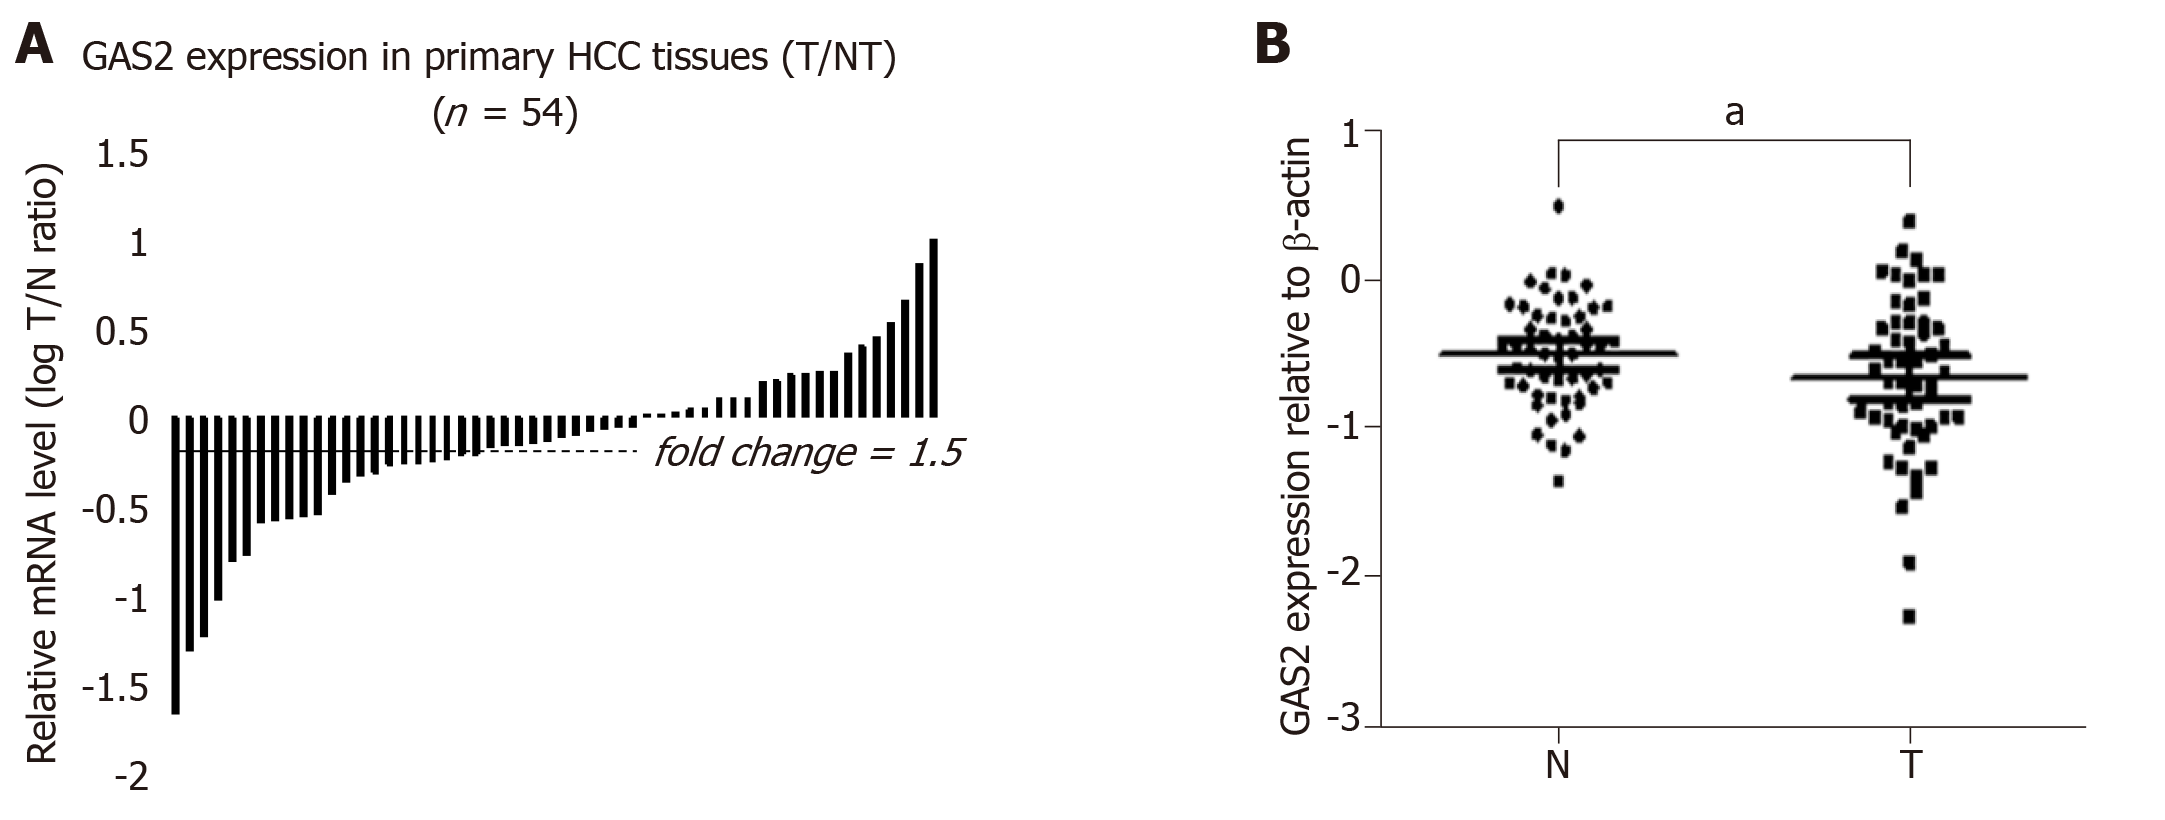
Figure 5 Expression of GAS2 in HCC specimens as determined by qPCR and western blotting.
A: Comparison of GAS2 mRNA expression in 54 paired tumor (T) and non-tumorous (N) tissues using PNN as an internal control. The bars (shown in log scale) illustrate the relative GAS2 mRNA level (T/N) in individual tissue pairs, of which negative and positive values respectively indicate downregulation and upregulation of GAS2 in HCC tumors. The differences of the T and N groups were statistically significant (P < 0.05 vs non-tumorous); B: Relative protein expression levels of GAS2 in 54 paired tumor (T) and non-tumorous (N) tissues using β-actin as an internal control. The average fold changes of GAS2 expression in tumor tissues were significantly lower than those in the paired non-tumor tissues (aP < 0.05 vs non-tumorous). GAS2: growth arrest-specific gene 2; HCC: Hepatocellular carcinoma.
- Citation: Zhu RX, Cheng ASL, Chan HLY, Yang DY, Seto WK. Growth arrest-specific gene 2 suppresses hepatocarcinogenesis by intervention of cell cycle and p53-dependent apoptosis. World J Gastroenterol 2019; 25(32): 4715-4726
- URL: https://www.wjgnet.com/1007-9327/full/v25/i32/4715.htm
- DOI: https://dx.doi.org/10.3748/wjg.v25.i32.4715


