Copyright
©The Author(s) 2019.
World J Gastroenterol. Jul 21, 2019; 25(27): 3590-3606
Published online Jul 21, 2019. doi: 10.3748/wjg.v25.i27.3590
Published online Jul 21, 2019. doi: 10.3748/wjg.v25.i27.3590
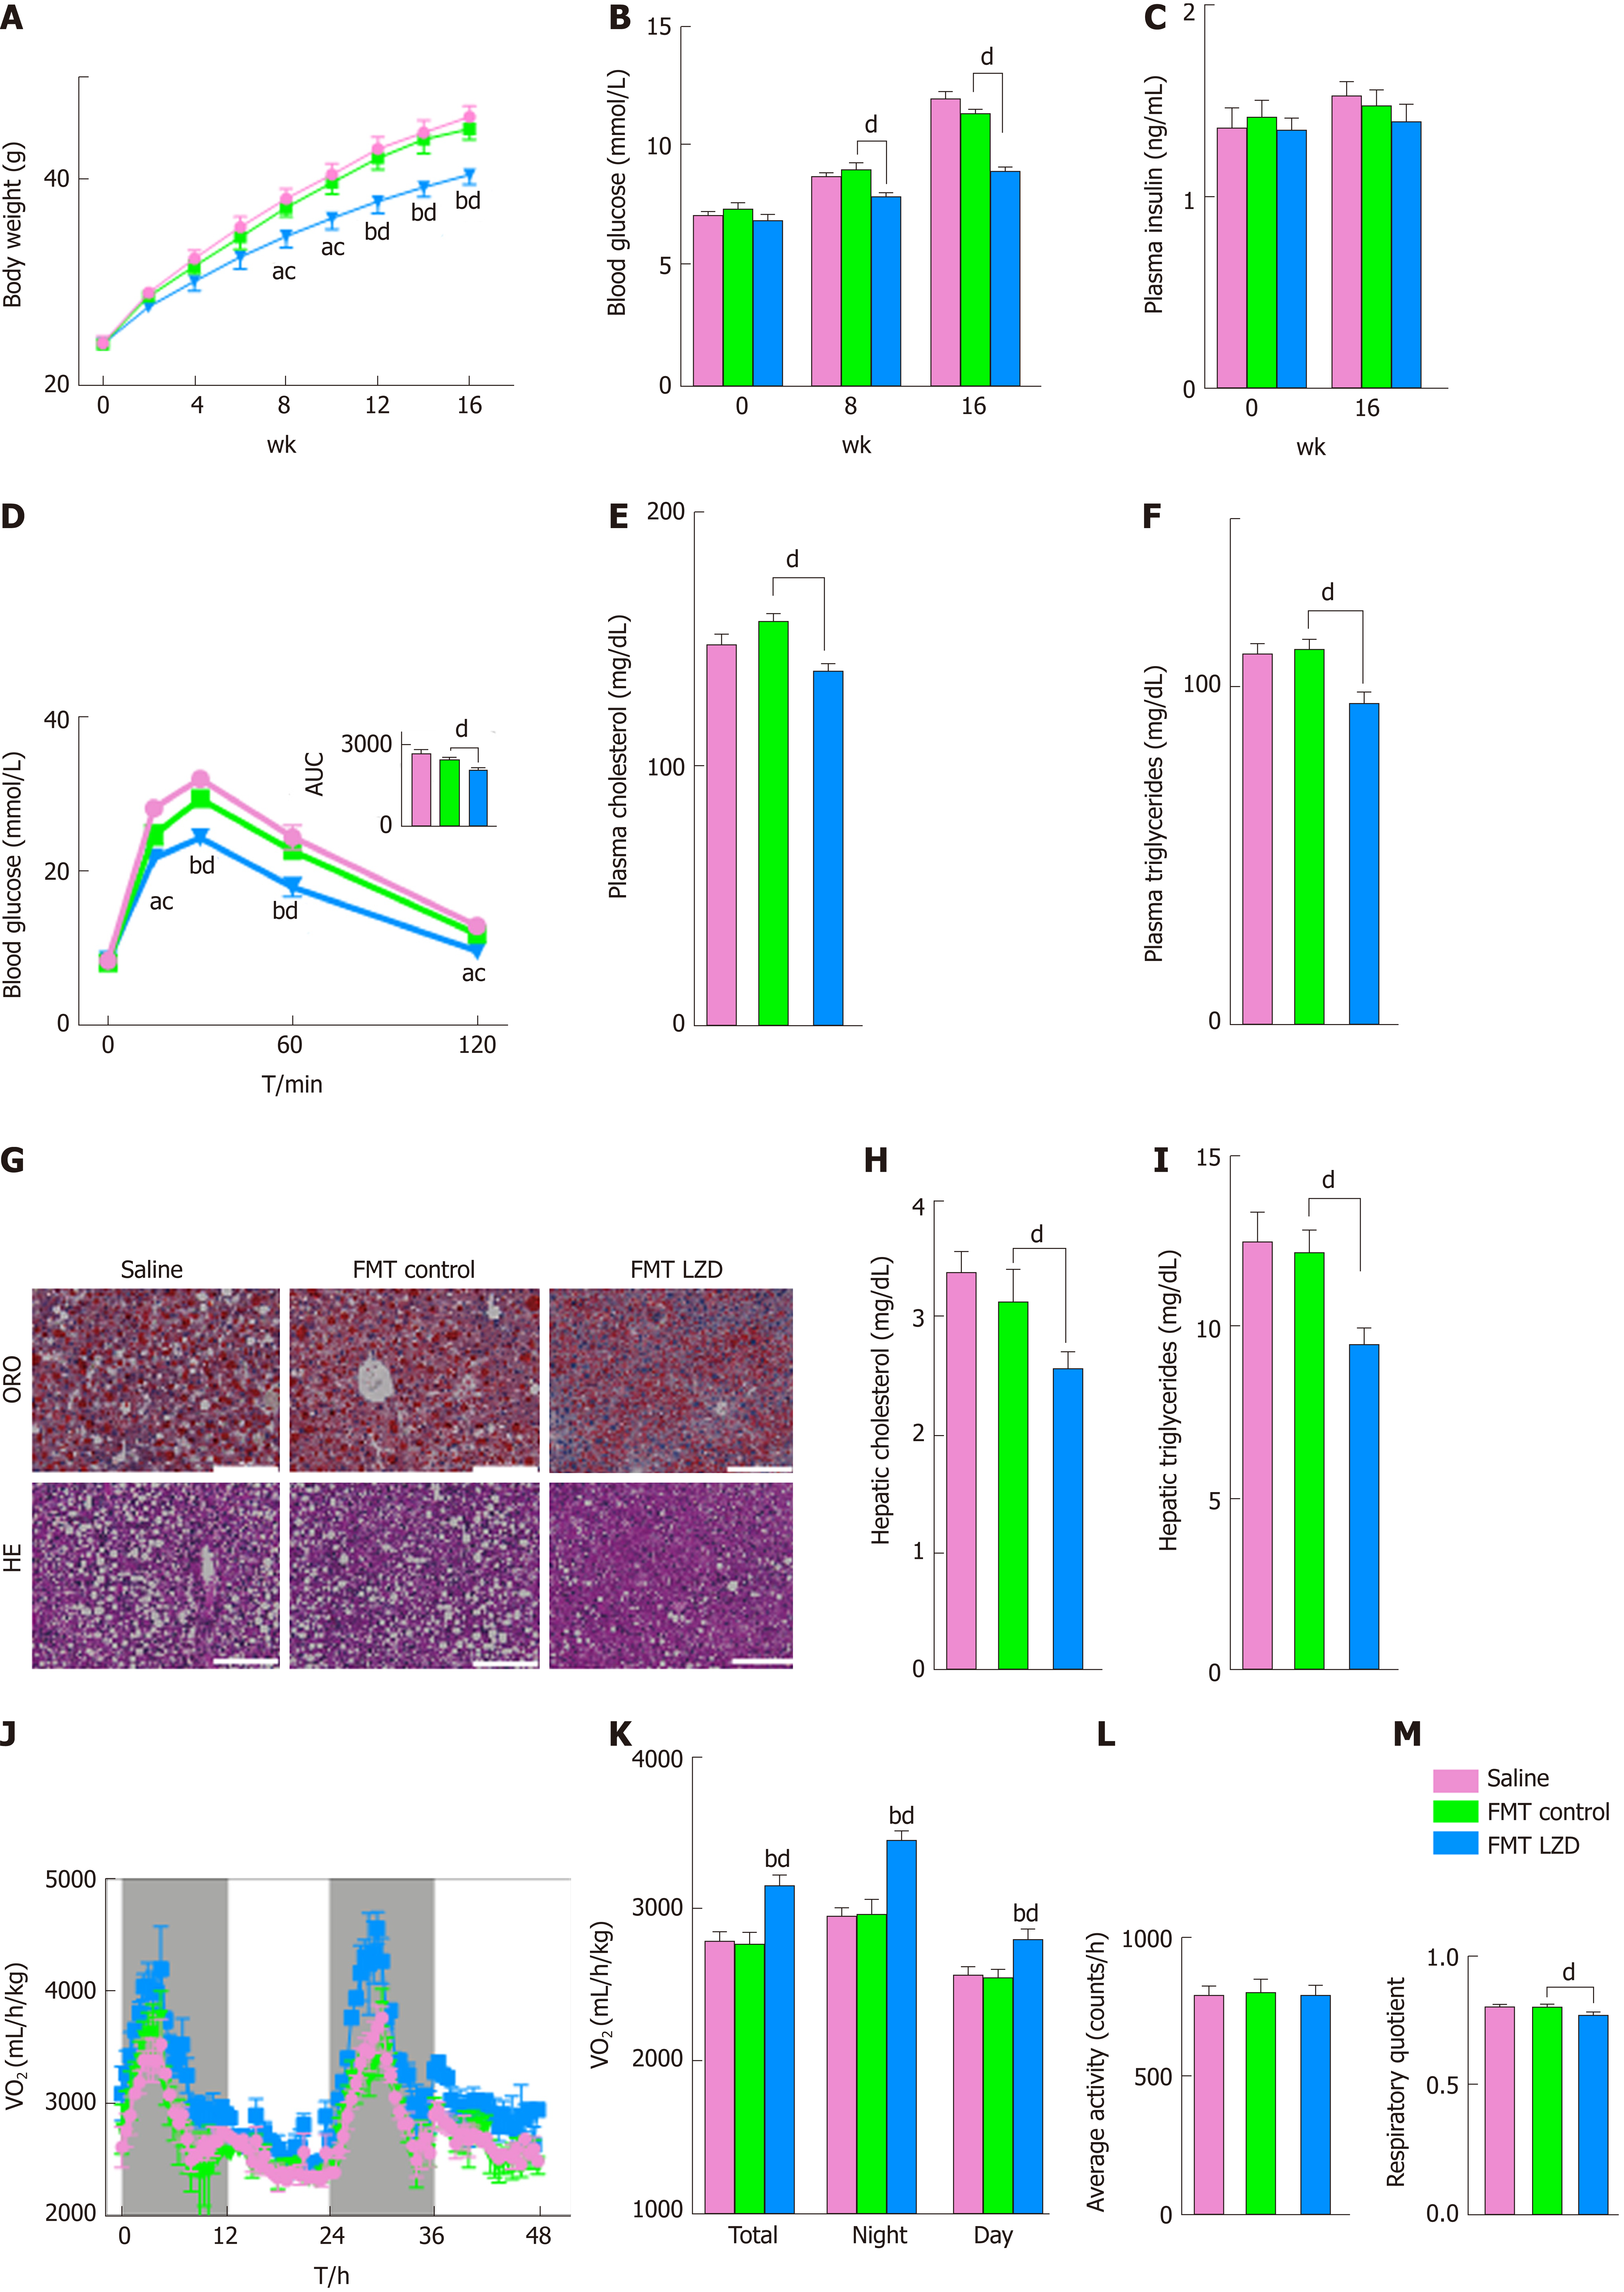
Figure 3 Fecal microbiota transplantation from caloric restriction and Lingguizhugan decoction-treated normal diet-fed mice into high-fat diet-fed C57BL/6J mice attenuates diet-induced obesity and hepatosteatosis.
Eight-week-old male C57BL/6J mice received saline gavage (denoted as Saline, pink), feces gavage from normal diet (ND)-fed control mice [denoted as fecal microbiota transplantation (FMT) control, green], or feces gavage from ND-fed mice receiving caloric restriction and Lingguizhugan decoction (CR + LZD) treatment (denoted as FMT LZD, blue) for 16 wk, and fed with HFD; n = 10 per group. A: Body weight was monitored biweekly during the experimental period, and each point and error represents the mean ± standard error; B: Fasting blood glucose levels were measured on weeks 0, 8 and 16; C: Plasma insulin levels were measured on weeks 0 and 16; D: Intraperitoneal glucose tolerance test was performed 1 wk prior to the end of the study. Glucose levels at each time point were compared by one-way ANOVA, and small letters indicate significant differences between FMT control and FMT LZD. Area under the curve was used to compare the overall differences between groups; E and F: Plasma total cholesterol (TC) and total triglycerides (TG) levels, respectively; G: Representative images of oil red O staining and hematoxylin and eosin staining of the liver (scale bar = 200 μm); H: Total cholesterol levels; I: Triglyceride levels; FMT control vs FMT LZD; J: Oxygen consumption of total test period, during the night, and during the day; K: Average oxygen consumption of total test period, during the night, and during the day; L: 24 h average physical activity; M: Respiratory quotient and of saline-treated, FMT control, and FMT LZD-treated mice were monitored with a metabolic monitoring system 3 d prior to death; n = 3 per group. Data were evaluated for statistical significance by one-way ANOVA and are represented as follows: aP < 0.05, bP < 0.01 FMT LZD vs Saline; cP < 0.05, dP < 0.01 FMT LZD vs FMT control. ND: Normal diet; LZD: Lingguizhigan decoction; HFD: High-fat diet; FMT: Fecal microbiota transplantation; AUC: Area under the curve; TC: Cholesterol; TG: Triglycerides; OCR: Oxygen consumption rate; ORO: Oil red O staining; HE: Hematoxylin and eosin staining.
- Citation: Liu MT, Huang YJ, Zhang TY, Tan LB, Lu XF, Qin J. Lingguizhugan decoction attenuates diet-induced obesity and hepatosteatosis via gut microbiota. World J Gastroenterol 2019; 25(27): 3590-3606
- URL: https://www.wjgnet.com/1007-9327/full/v25/i27/3590.htm
- DOI: https://dx.doi.org/10.3748/wjg.v25.i27.3590


