Copyright
©The Author(s) 2019.
World J Gastroenterol. Jun 21, 2019; 25(23): 2911-2923
Published online Jun 21, 2019. doi: 10.3748/wjg.v25.i23.2911
Published online Jun 21, 2019. doi: 10.3748/wjg.v25.i23.2911
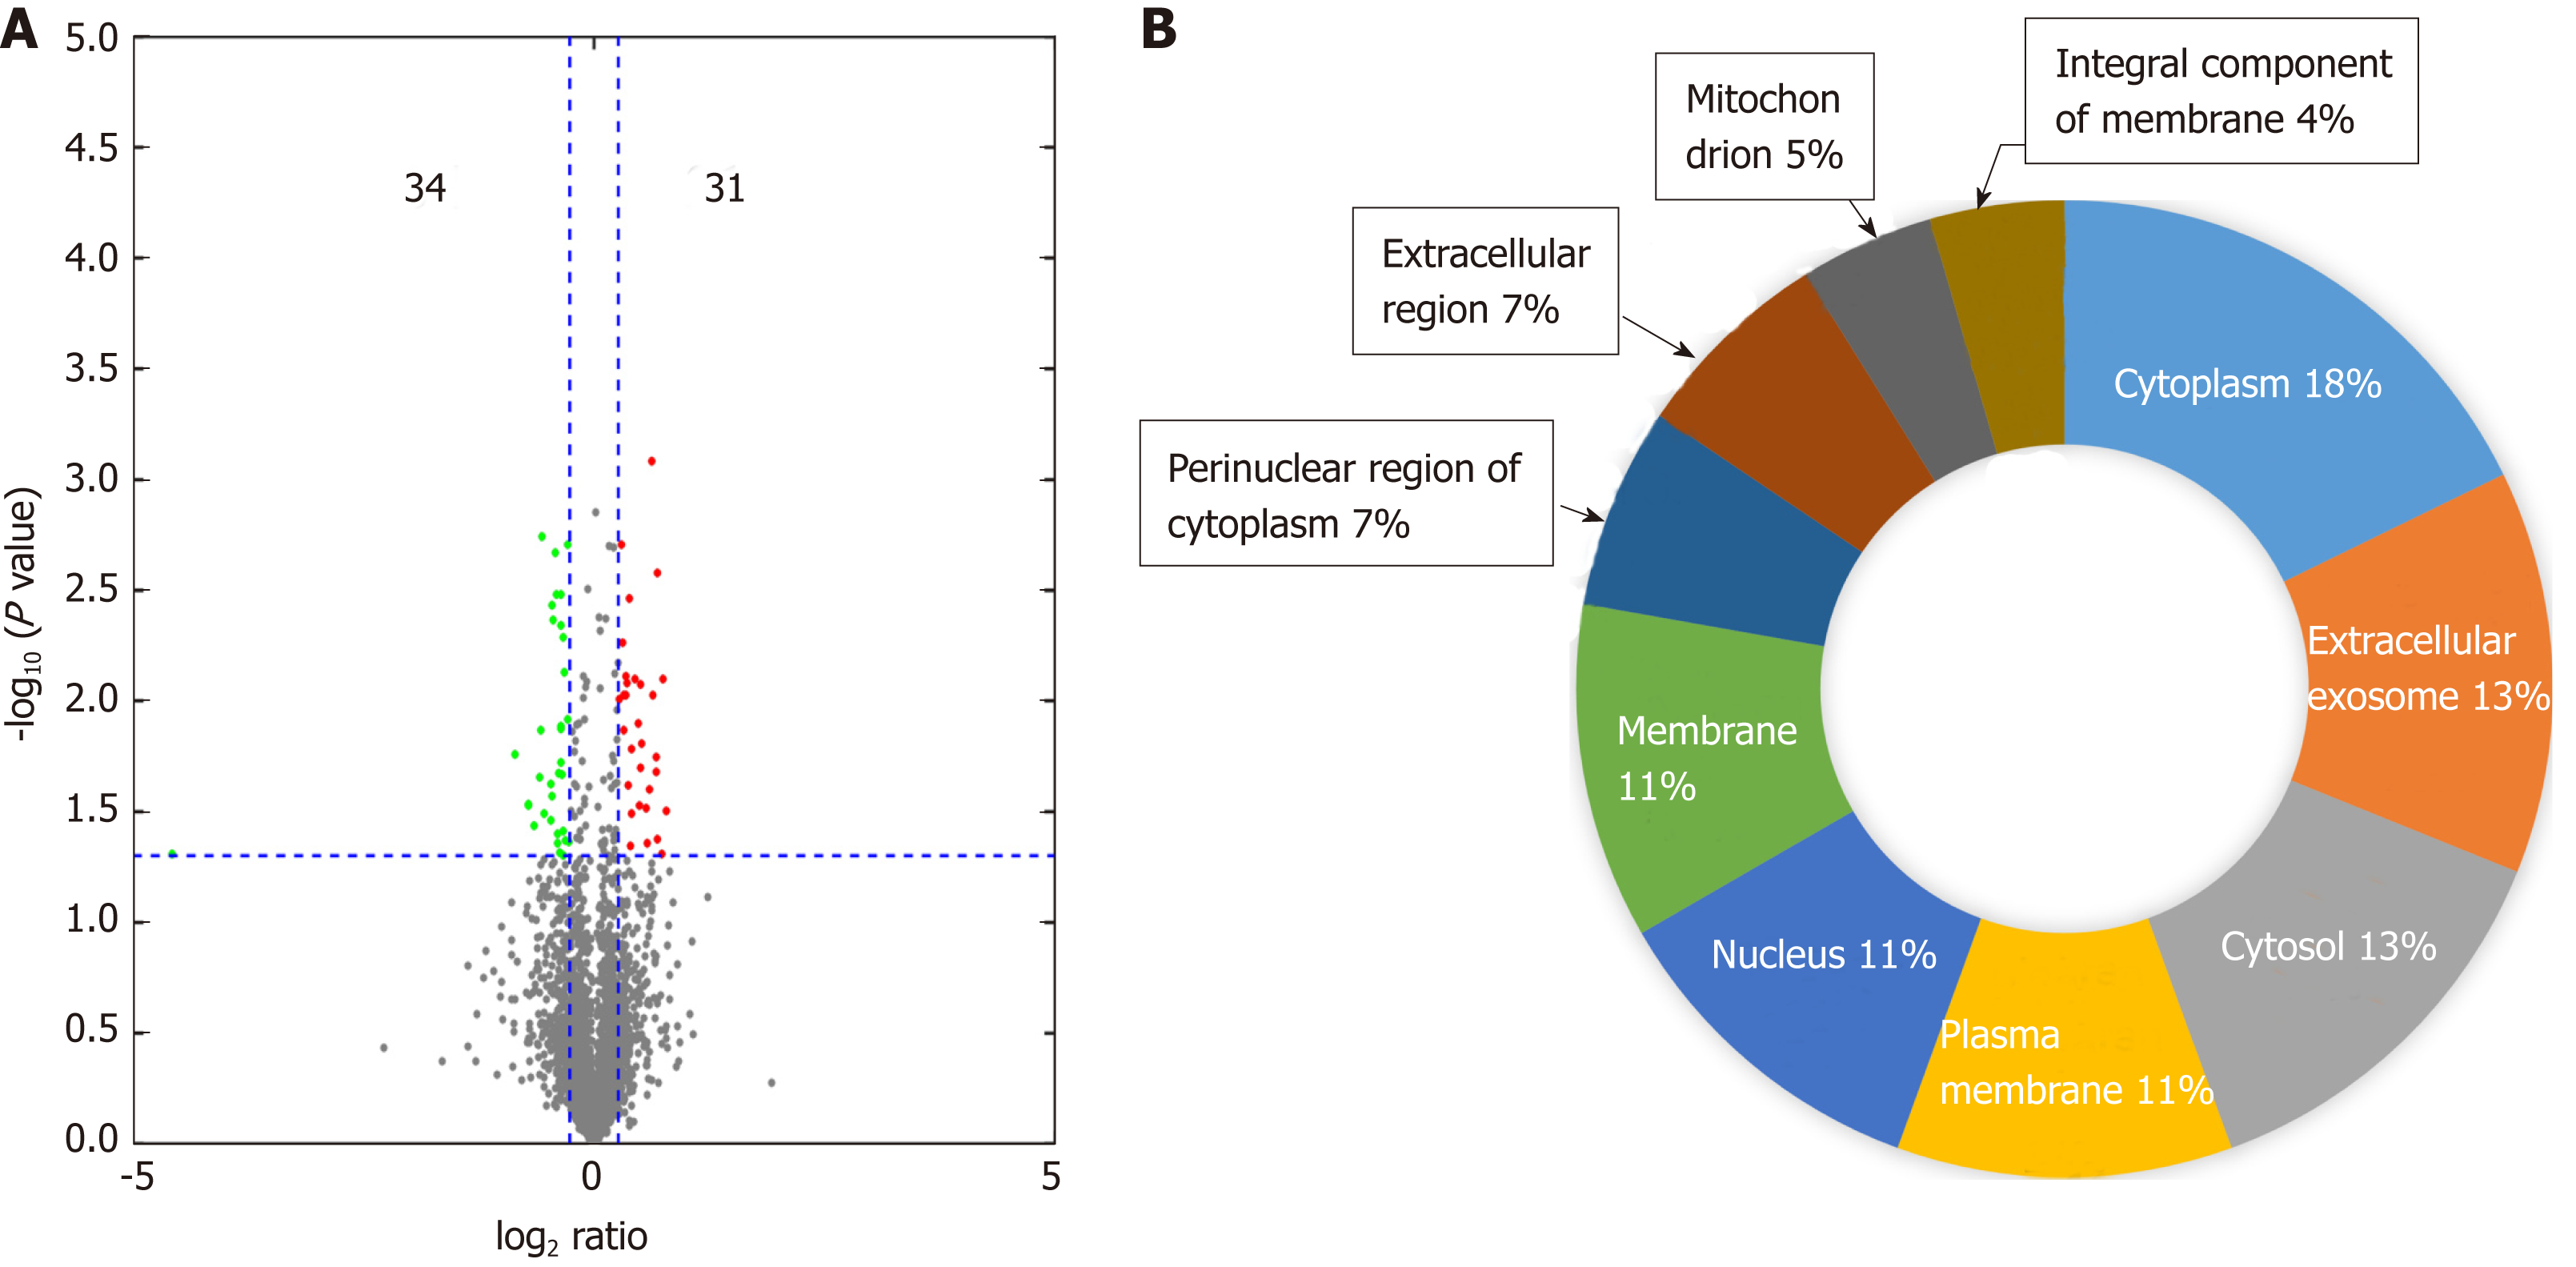
Figure 2 Features of the proteomic data from rats subjected to restraint water-immersion stress for 0 h and 4 h.
The data were obtained by isobaric tags for relative and absolute quantitation shotgun analysis. A: Volcano plot indicating the changes in protein abundance in the mediodorsal thalamic nucleus between the control and stressed rats. A total of 65 dysregulated proteins with at least a ±1.2-fold change and P < 0.05 were identified. Orange dots indicate the upregulated proteins, and blue dots indicate the downregulated proteins; B: Subcellular localizations of the identified proteins.
- Citation: Gong SN, Zhu JP, Ma YJ, Zhao DQ. Proteomics of the mediodorsal thalamic nucleus of rats with stress-induced gastric ulcer. World J Gastroenterol 2019; 25(23): 2911-2923
- URL: https://www.wjgnet.com/1007-9327/full/v25/i23/2911.htm
- DOI: https://dx.doi.org/10.3748/wjg.v25.i23.2911


