Copyright
©The Author(s) 2019.
World J Gastroenterol. Jun 14, 2019; 25(22): 2752-2762
Published online Jun 14, 2019. doi: 10.3748/wjg.v25.i22.2752
Published online Jun 14, 2019. doi: 10.3748/wjg.v25.i22.2752
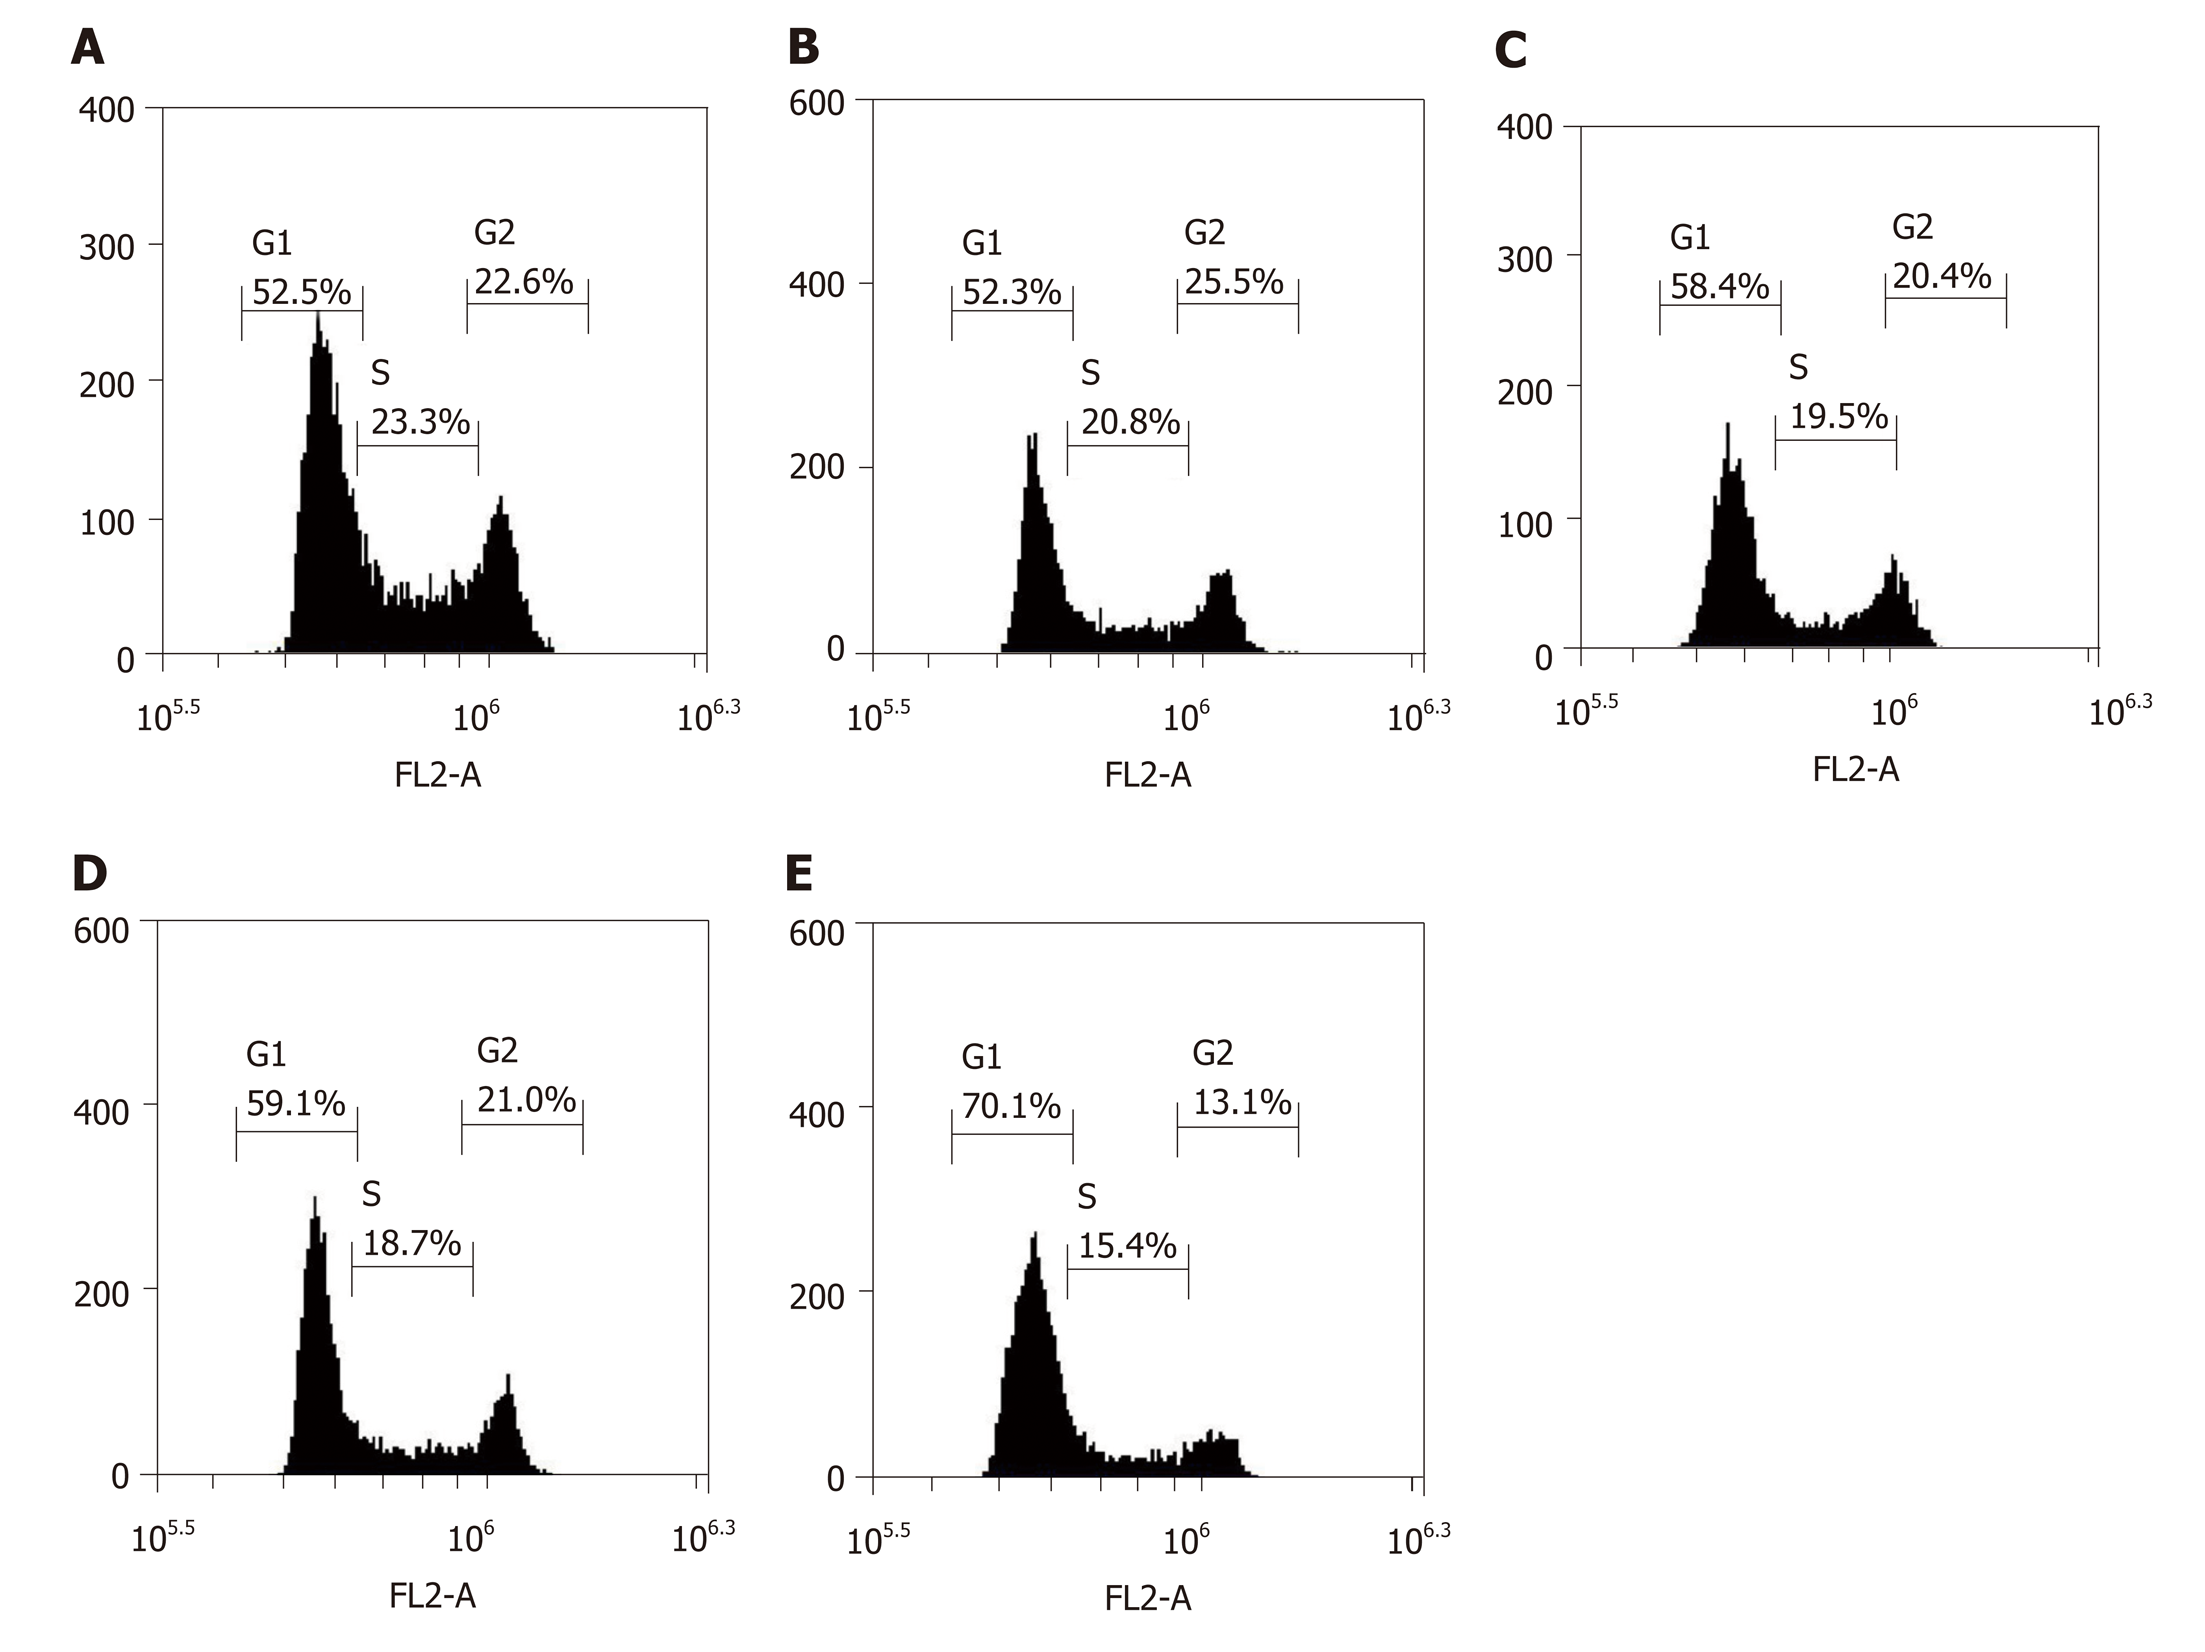
Figure 4 Proportion of G1 phase cells in each group after HepG2 cells were treated for 72 h.
A: Blank control group; B: LV-hsa-mir-34a group; C: Doxorubicin treatment group; D: Empty vector + doxorubicin treatment group; E: LV-hsa-mir-34a + doxorubicin treatment group.
- Citation: Zheng SZ, Sun P, Wang JP, Liu Y, Gong W, Liu J. MiR-34a overexpression enhances the inhibitory effect of doxorubicin on HepG2 cells. World J Gastroenterol 2019; 25(22): 2752-2762
- URL: https://www.wjgnet.com/1007-9327/full/v25/i22/2752.htm
- DOI: https://dx.doi.org/10.3748/wjg.v25.i22.2752


