Copyright
©The Author(s) 2019.
World J Gastroenterol. Jan 14, 2019; 25(2): 269-281
Published online Jan 14, 2019. doi: 10.3748/wjg.v25.i2.269
Published online Jan 14, 2019. doi: 10.3748/wjg.v25.i2.269
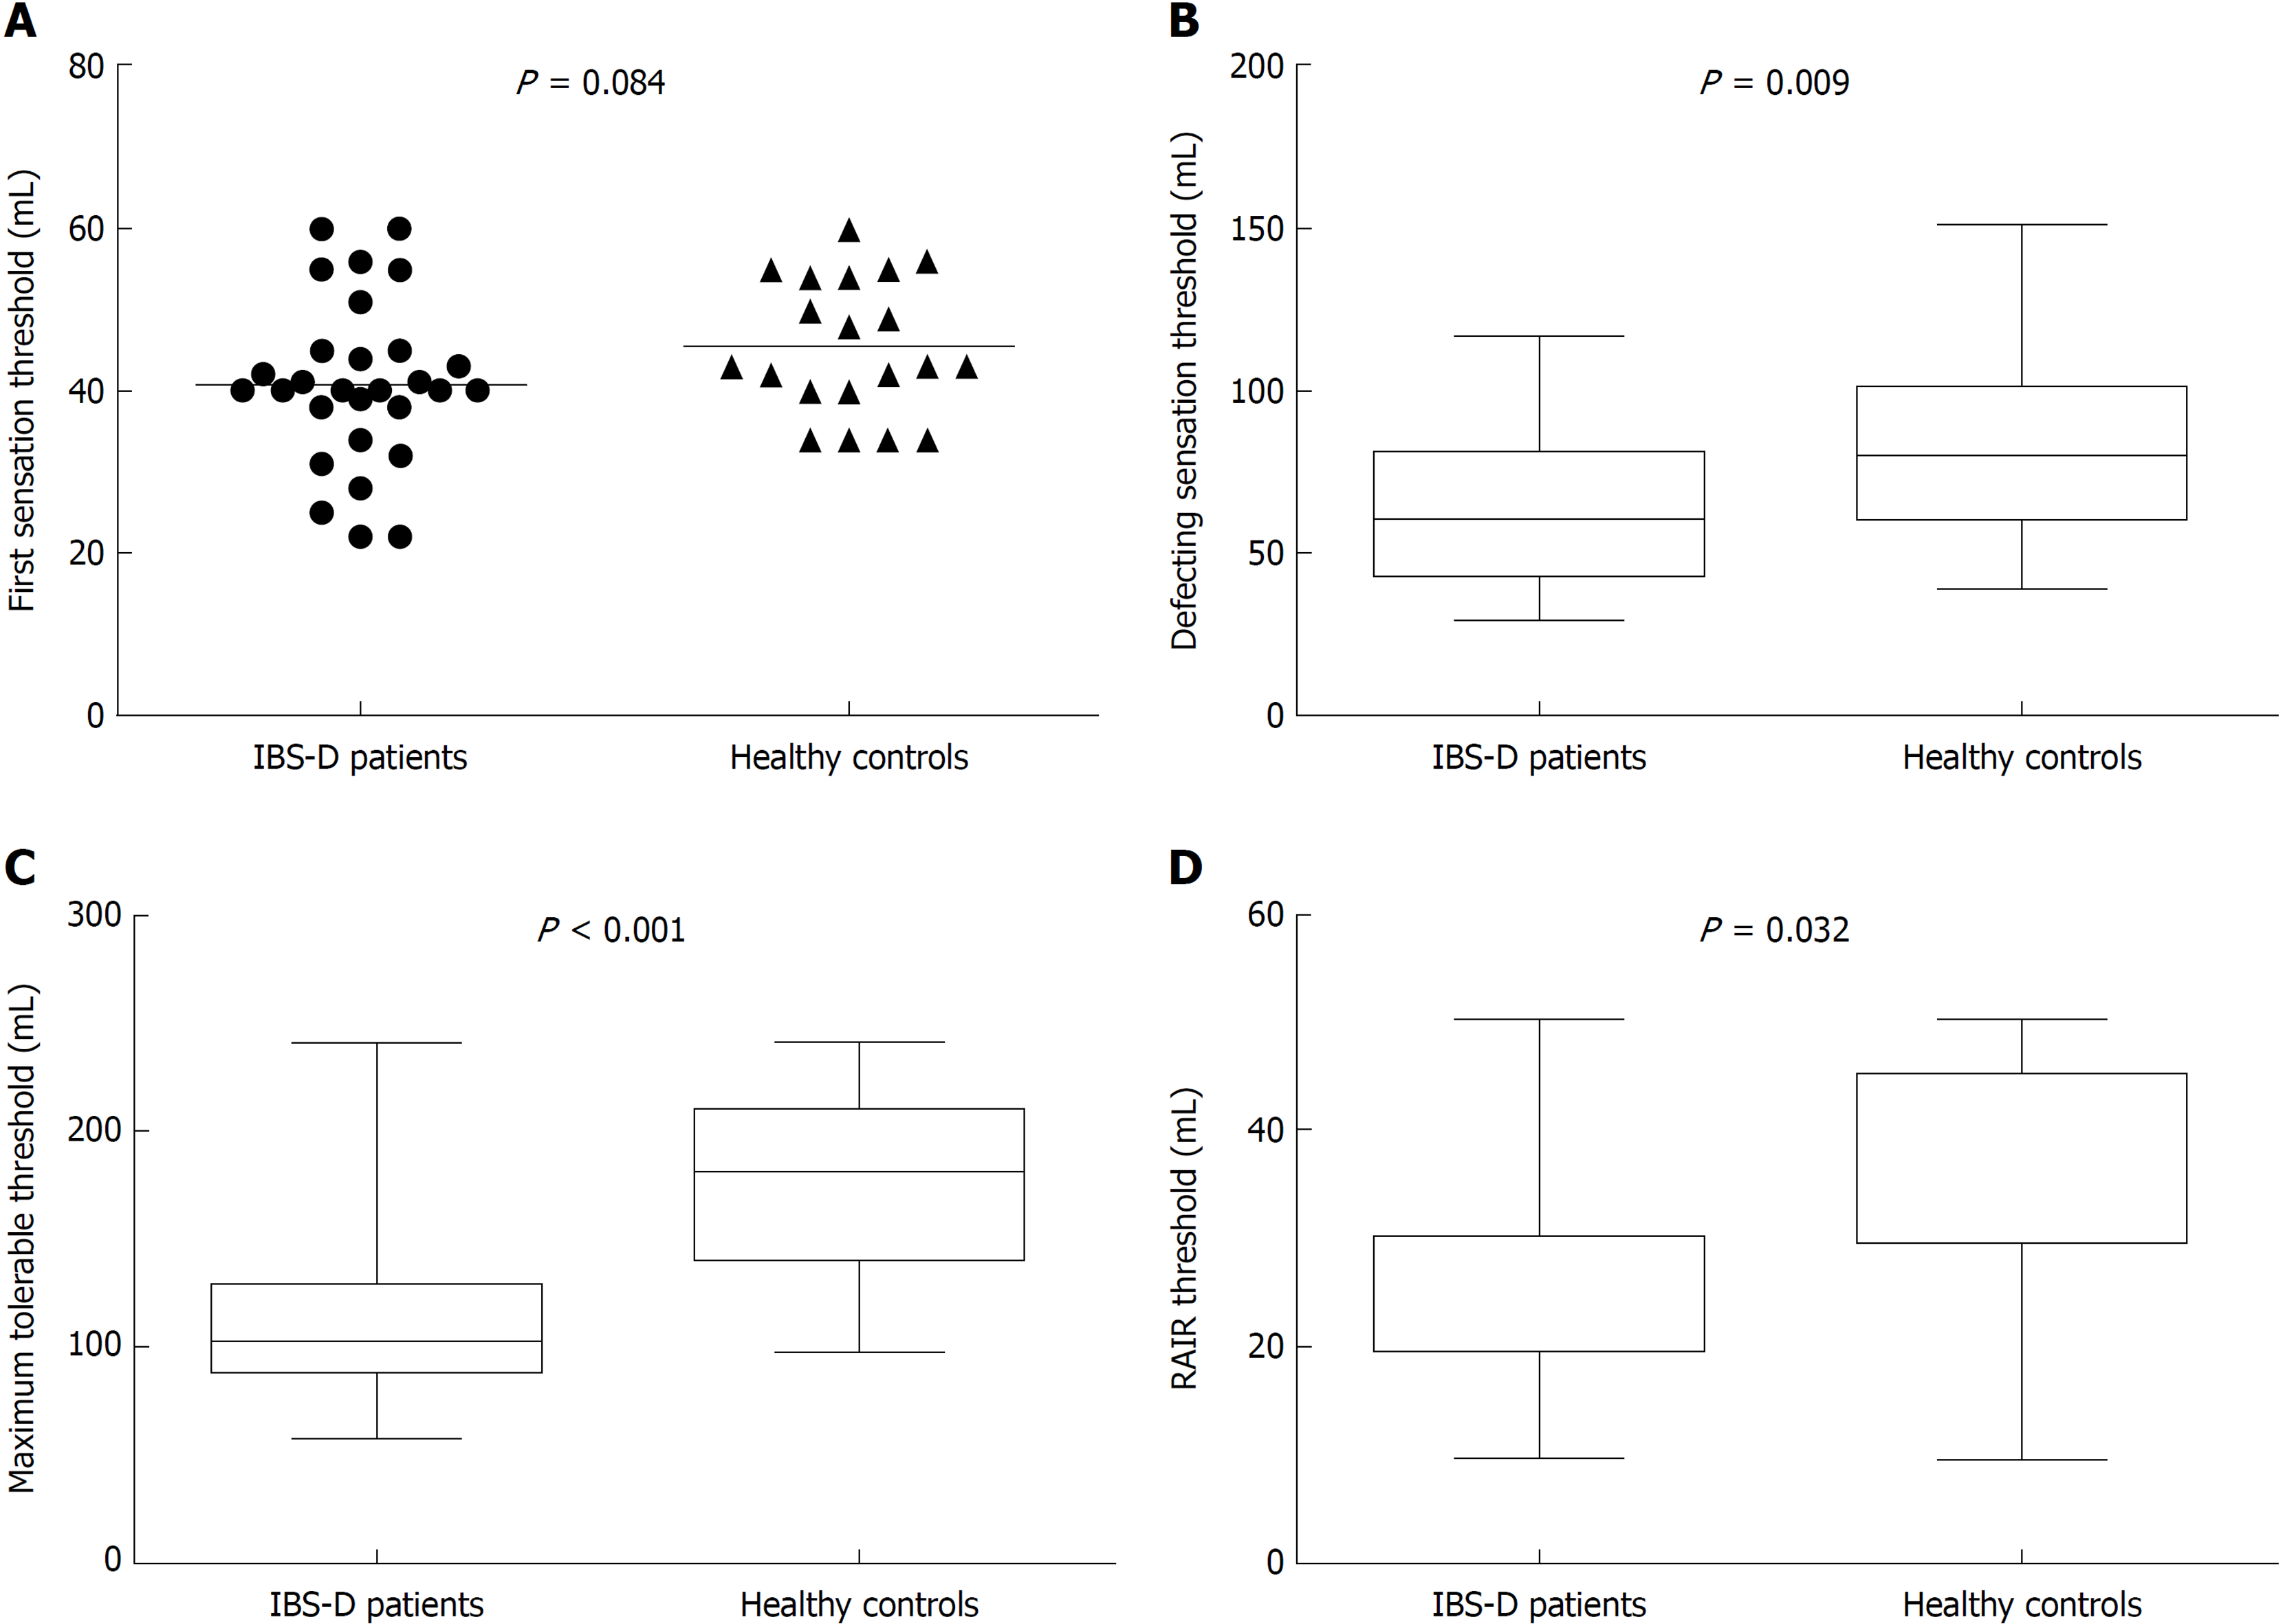
Figure 1 Visceral sensitivity parameters in patients with diarrhea-predominant irritable bowel syndrome and healthy controls.
A: The first sensation threshold was not significantly different between the two groups (P = 0.084); B: The defecating sensation threshold was significantly lower in diarrhea-predominant irritable bowel syndrome (IBS-D) patients than in controls (P = 0.009); C: The maximum tolerable threshold was significantly decreased in the patients (P < 0.001); D: The rectoanal inhibitory reflex threshold was also significantly lower in IBS-D patients (P = 0.032). Each set of data is presented as box-whisker plot or scatter plot. Boxes indicate the interquartile range; lines inside the boxes indicate the medians (the median lines and the edges of the boxes of plot D overlap); the two whiskers indicate the maximum and minimum of the data; and the lines in the scatter plots indicate the mean values. RAIR: Rectoanal inhibitory reflex; IBS-D: Diarrhea-predominant irritable bowel syndrome.
- Citation: Zhang Y, Qin G, Liu DR, Wang Y, Yao SK. Increased expression of brain-derived neurotrophic factor is correlated with visceral hypersensitivity in patients with diarrhea-predominant irritable bowel syndrome. World J Gastroenterol 2019; 25(2): 269-281
- URL: https://www.wjgnet.com/1007-9327/full/v25/i2/269.htm
- DOI: https://dx.doi.org/10.3748/wjg.v25.i2.269


