Copyright
©The Author(s) 2019.
World J Gastroenterol. May 21, 2019; 25(19): 2383-2401
Published online May 21, 2019. doi: 10.3748/wjg.v25.i19.2383
Published online May 21, 2019. doi: 10.3748/wjg.v25.i19.2383
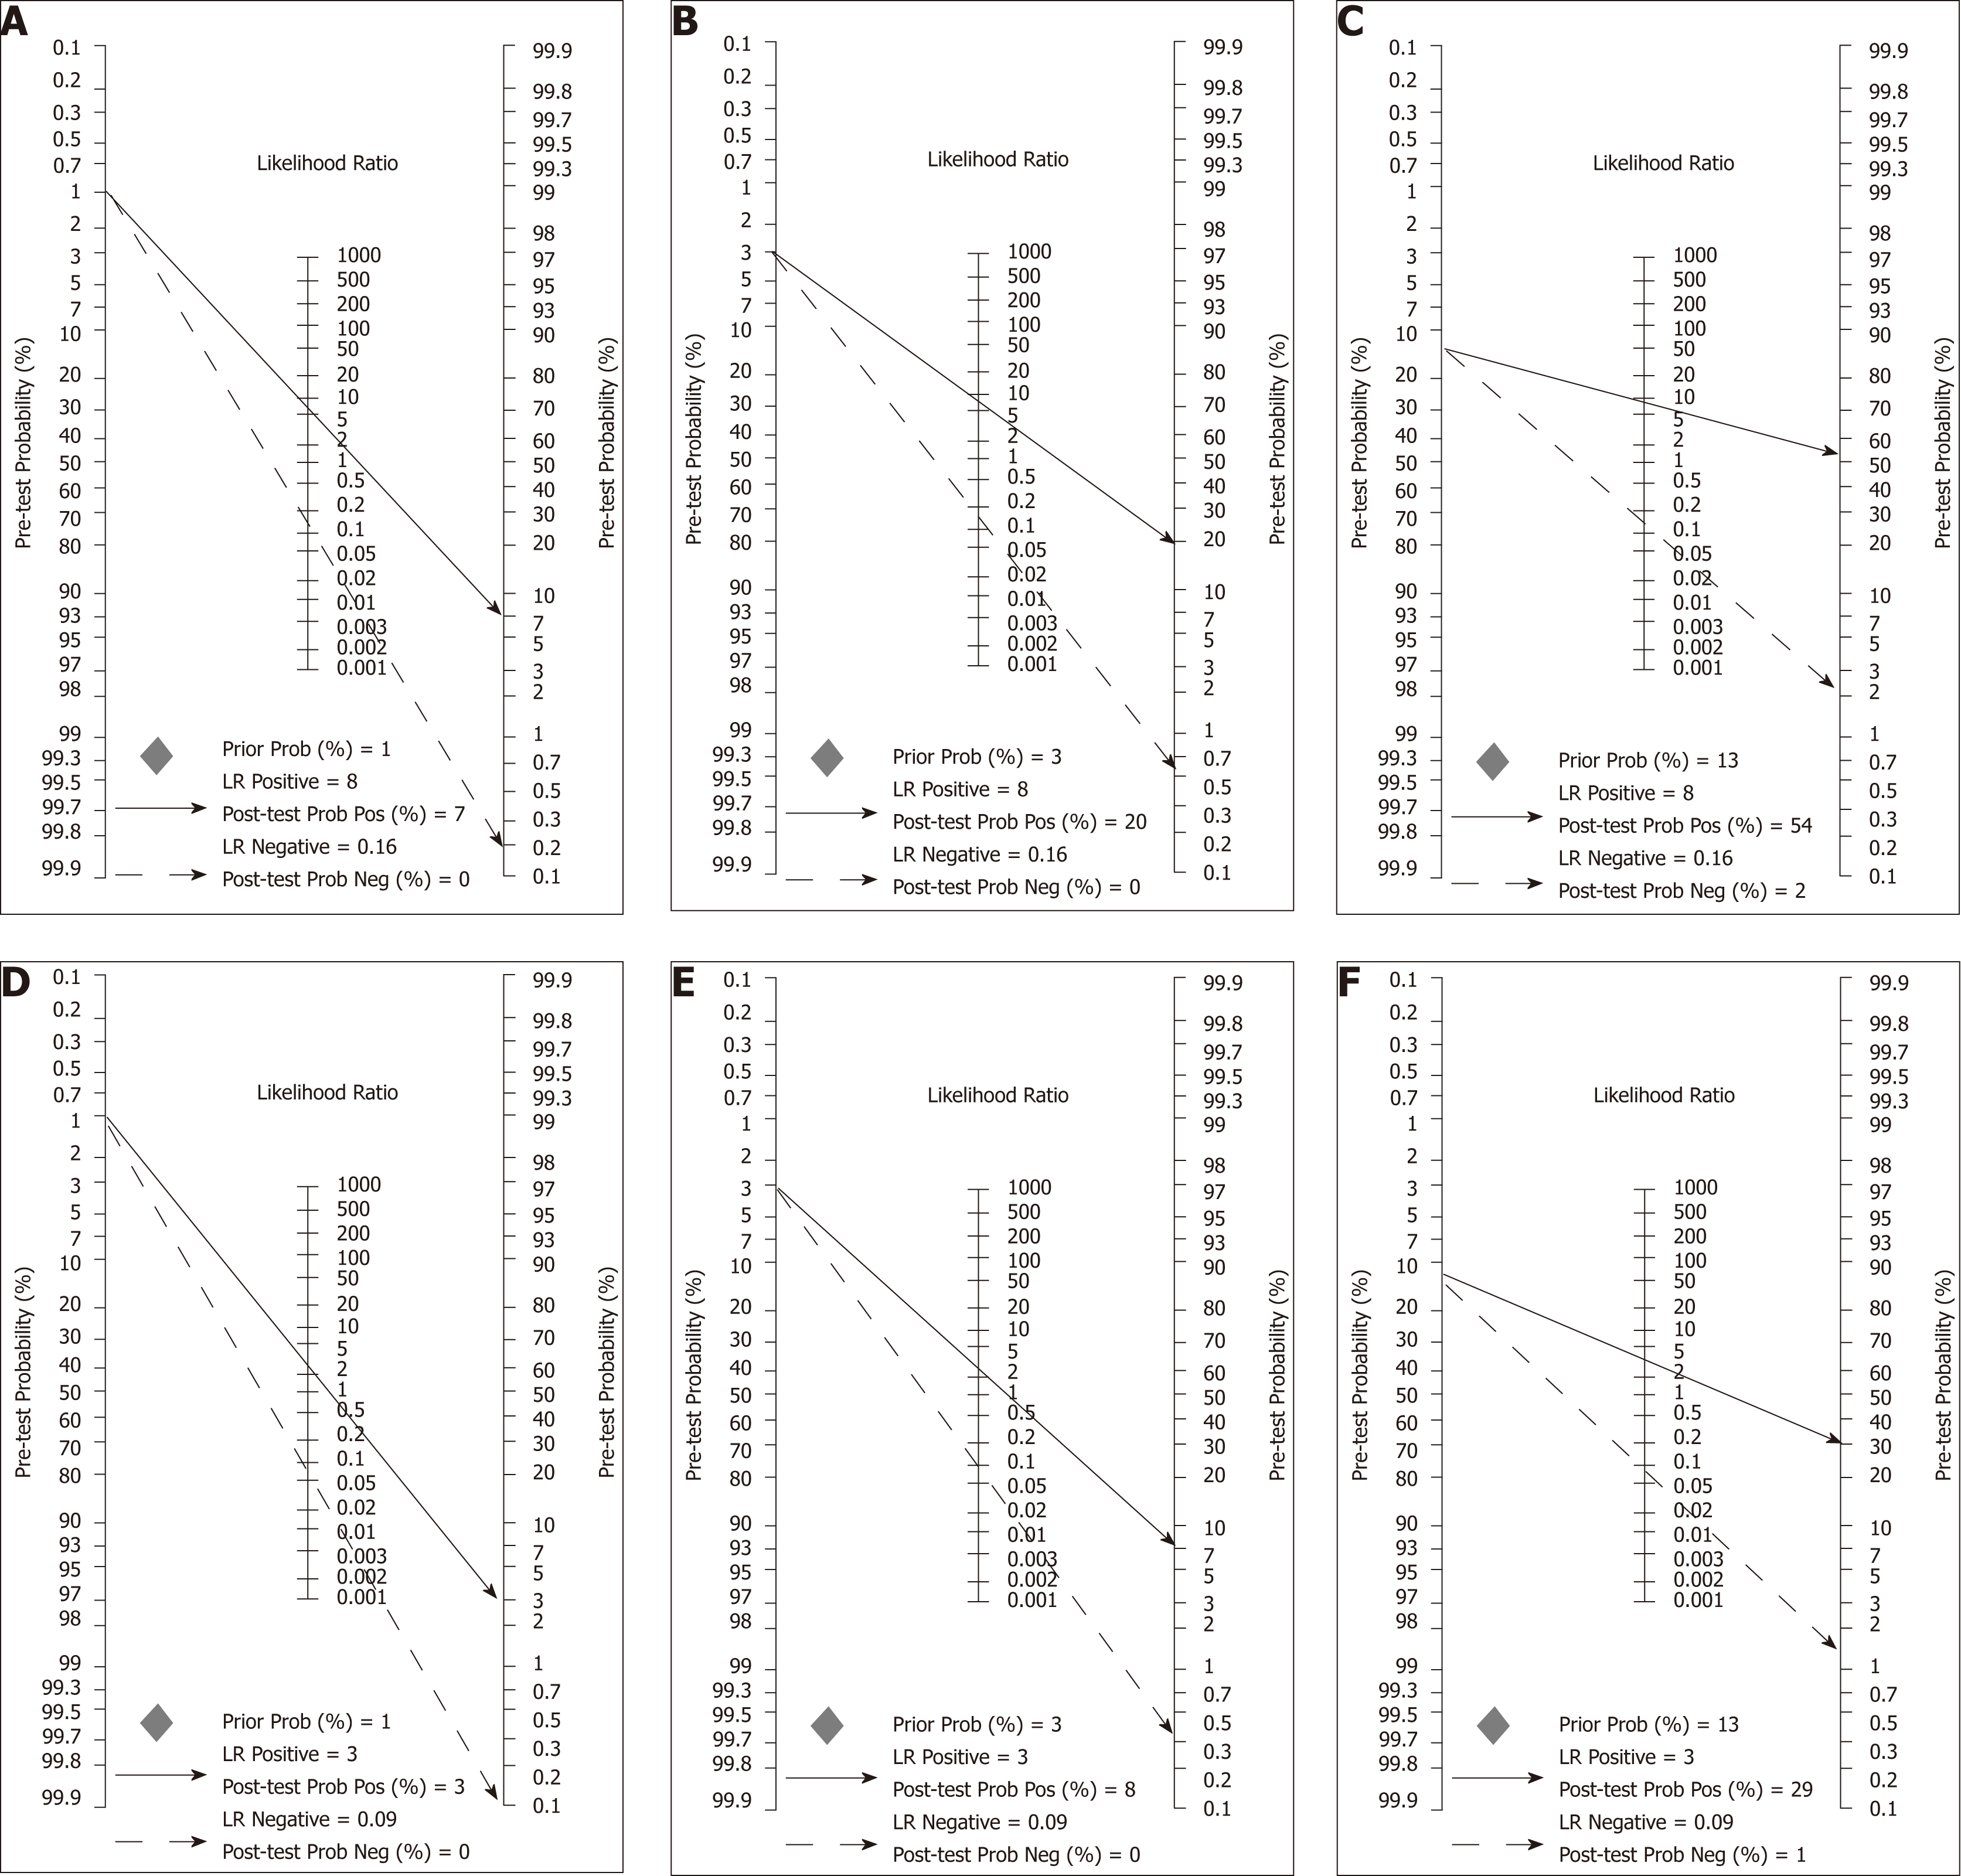
Figure 9 Fagan nomograms used to calculate post-test probabilities based on different scenarios defined by colorectal cancer prevalence and supposed accuracy of OC-Sensor (Threshold 10 µg Hb/g faeces).
A-C; These scenarios are defined by colorectal cancer (CRC) prevalence of 1%, 3% and 13% respectively and faecal immunochemical test for haemoglobin (FIT) accuracy parameters used were the pooled estimates calculated with ‘mixed cohorts’ studies; D-F; These scenarios are defined by CRC prevalence of 1%, 3% and 13% respectively and FIT accuracy parameters used were the pooled estimates calculated with ‘100% symptomatic’ studies. CRC: Colorectal cancer; FIT: Faecal immunochemical test for haemoglobin.
- Citation: Pin Vieito N, Zarraquiños S, Cubiella J. High-risk symptoms and quantitative faecal immunochemical test accuracy: Systematic review and meta-analysis. World J Gastroenterol 2019; 25(19): 2383-2401
- URL: https://www.wjgnet.com/1007-9327/full/v25/i19/2383.htm
- DOI: https://dx.doi.org/10.3748/wjg.v25.i19.2383


