Copyright
©The Author(s) 2019.
World J Gastroenterol. May 21, 2019; 25(19): 2338-2353
Published online May 21, 2019. doi: 10.3748/wjg.v25.i19.2338
Published online May 21, 2019. doi: 10.3748/wjg.v25.i19.2338
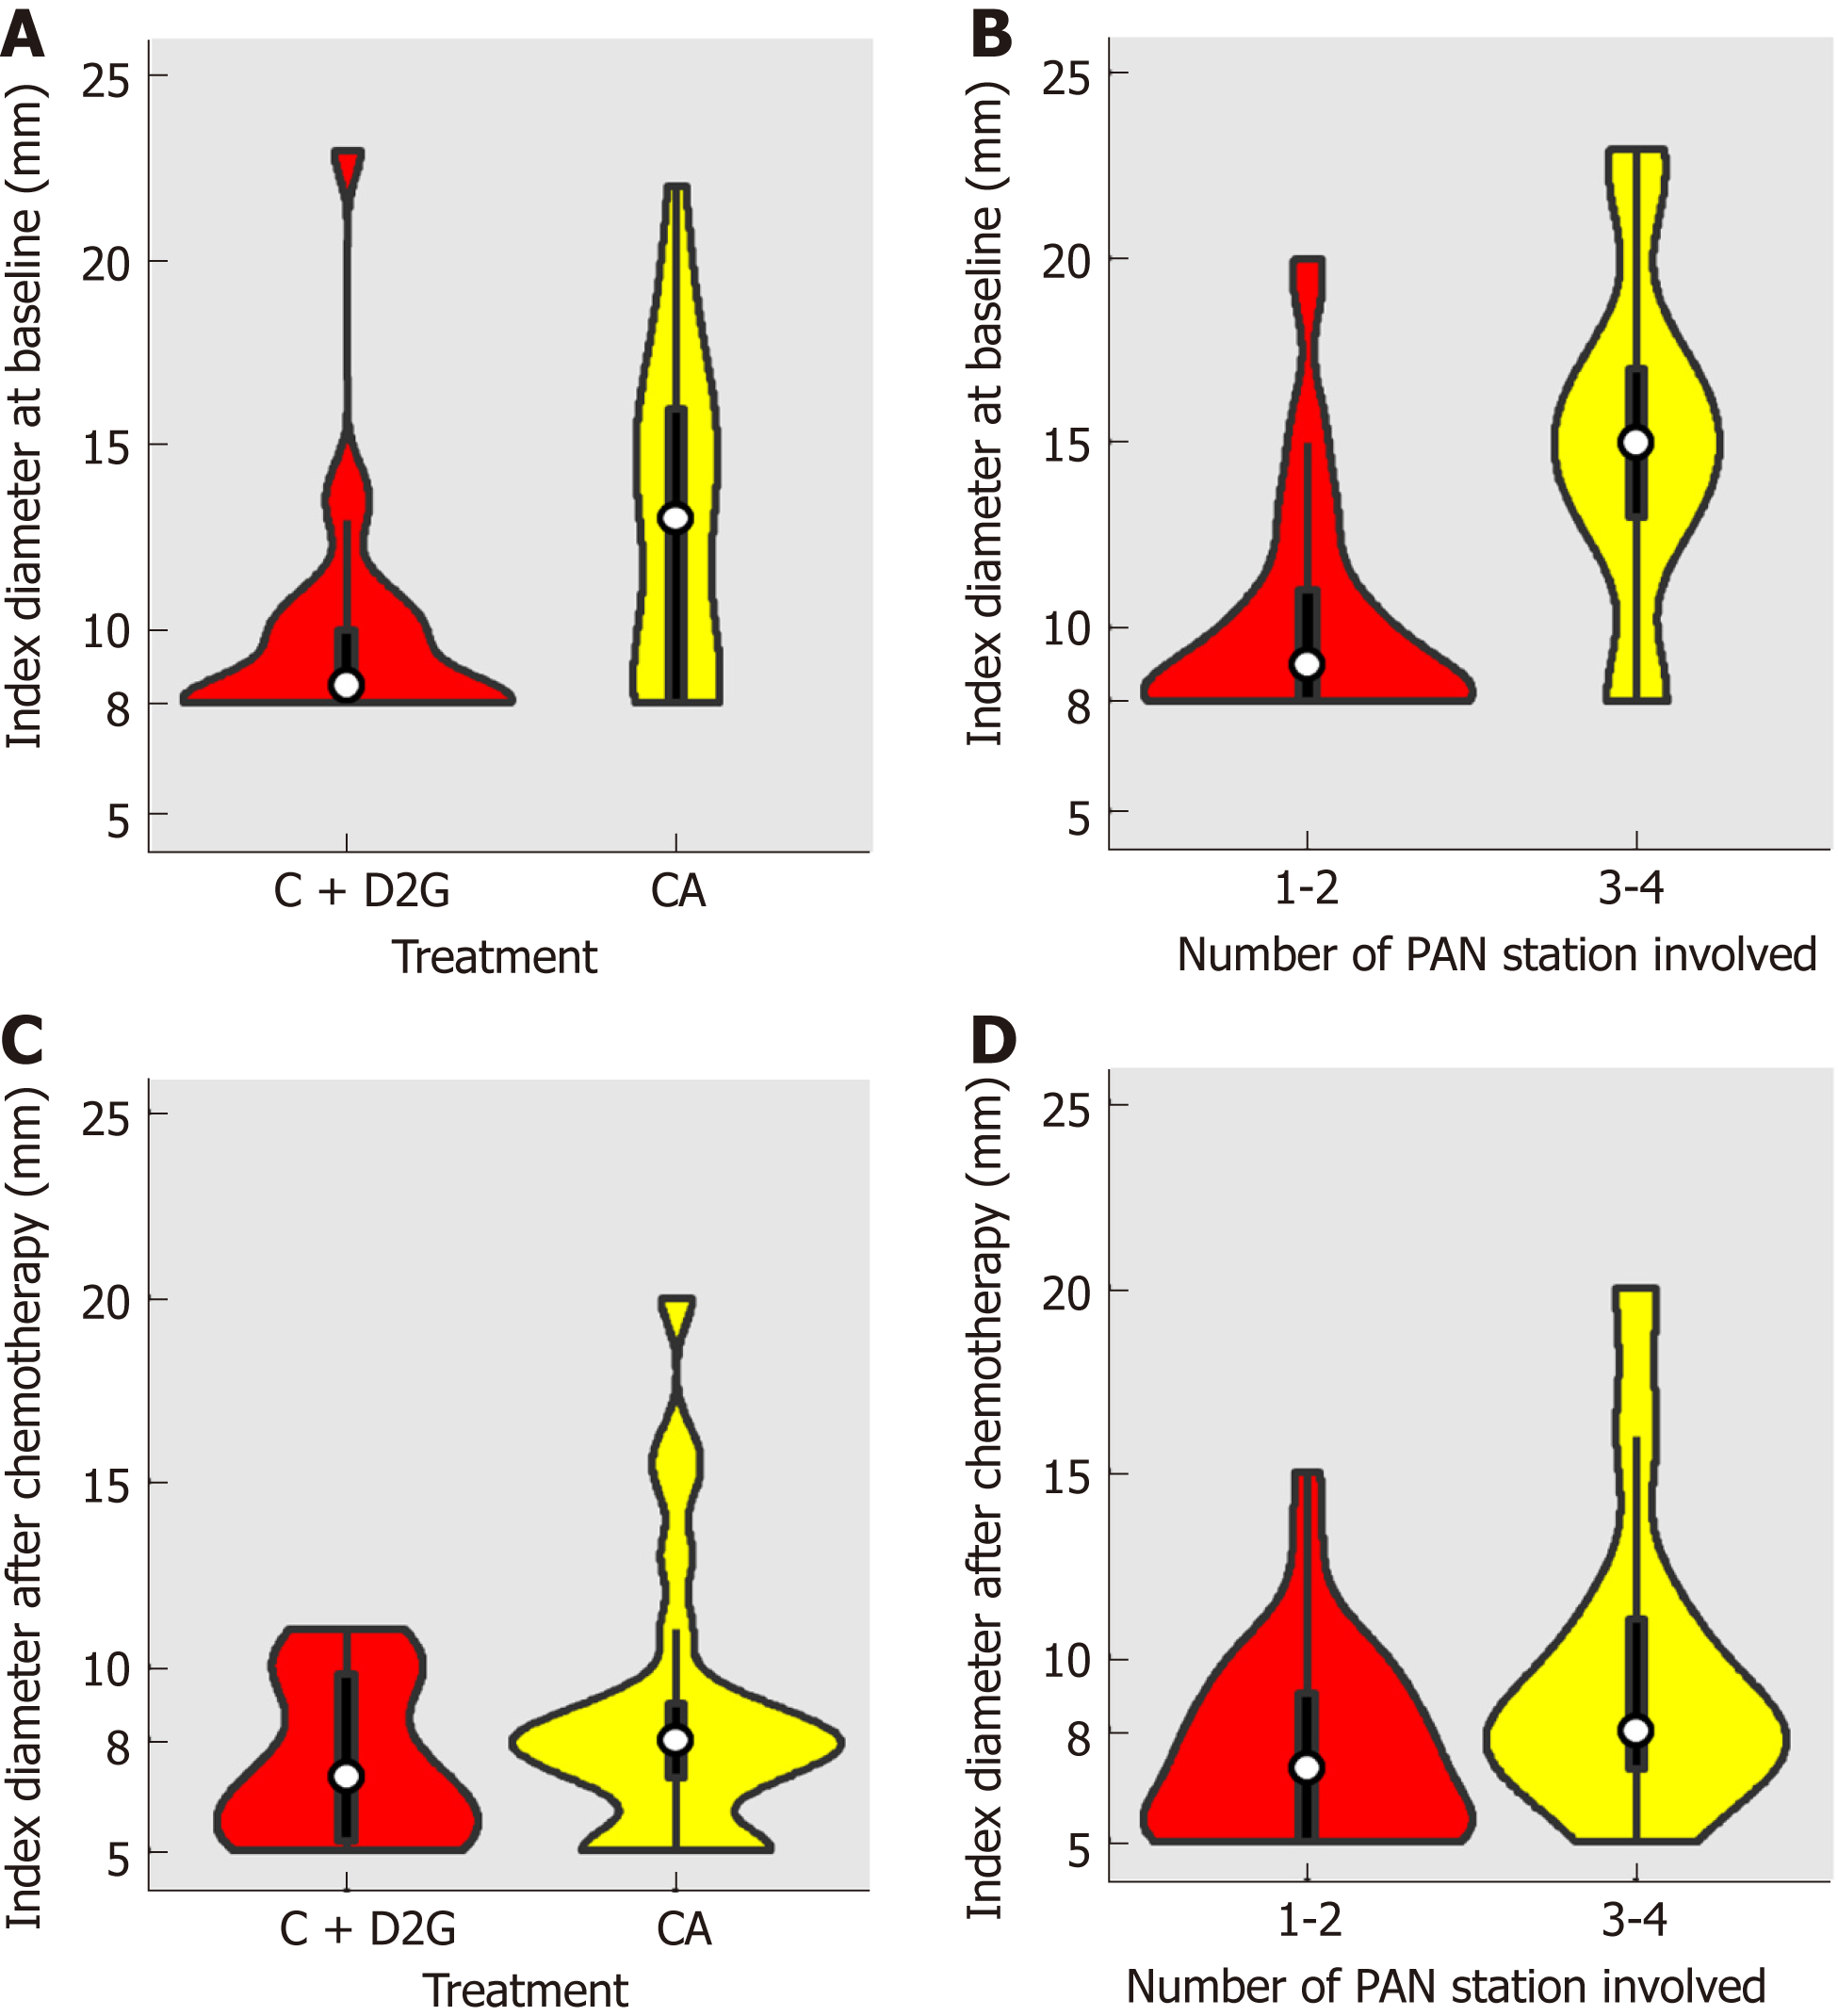
Figure 2 Violin plots of index diameter distribution of all patients.
A: Violin plots of index diameter distribution at baseline of patients who underwent D2 resection or not; B: Violin plots of index diameter distribution at baseline of patients with involvement of more than two para-aortic lymph node stations or not; C: Violin plots of index diameter distribution of patients who underwent D2 resection or not after initial chemotherapy; D: Violin plots of index diameter distribution after initial chemotherapy of patients with involvement of more than two para-aortic lymph node stations or not. CA: Chemotherapy alone; C+D2G: Chemotherapy plus D2 gastrectomy; PAN: Para-aortic lymph node.
- Citation: Zheng XH, Zhang W, Yang L, Du CX, Li N, Xing GS, Tian YT, Xie YB. Role of D2 gastrectomy in gastric cancer with clinical para-aortic lymph node metastasis. World J Gastroenterol 2019; 25(19): 2338-2353
- URL: https://www.wjgnet.com/1007-9327/full/v25/i19/2338.htm
- DOI: https://dx.doi.org/10.3748/wjg.v25.i19.2338


