Copyright
©The Author(s) 2019.
World J Gastroenterol. May 7, 2019; 25(17): 2099-2109
Published online May 7, 2019. doi: 10.3748/wjg.v25.i17.2099
Published online May 7, 2019. doi: 10.3748/wjg.v25.i17.2099
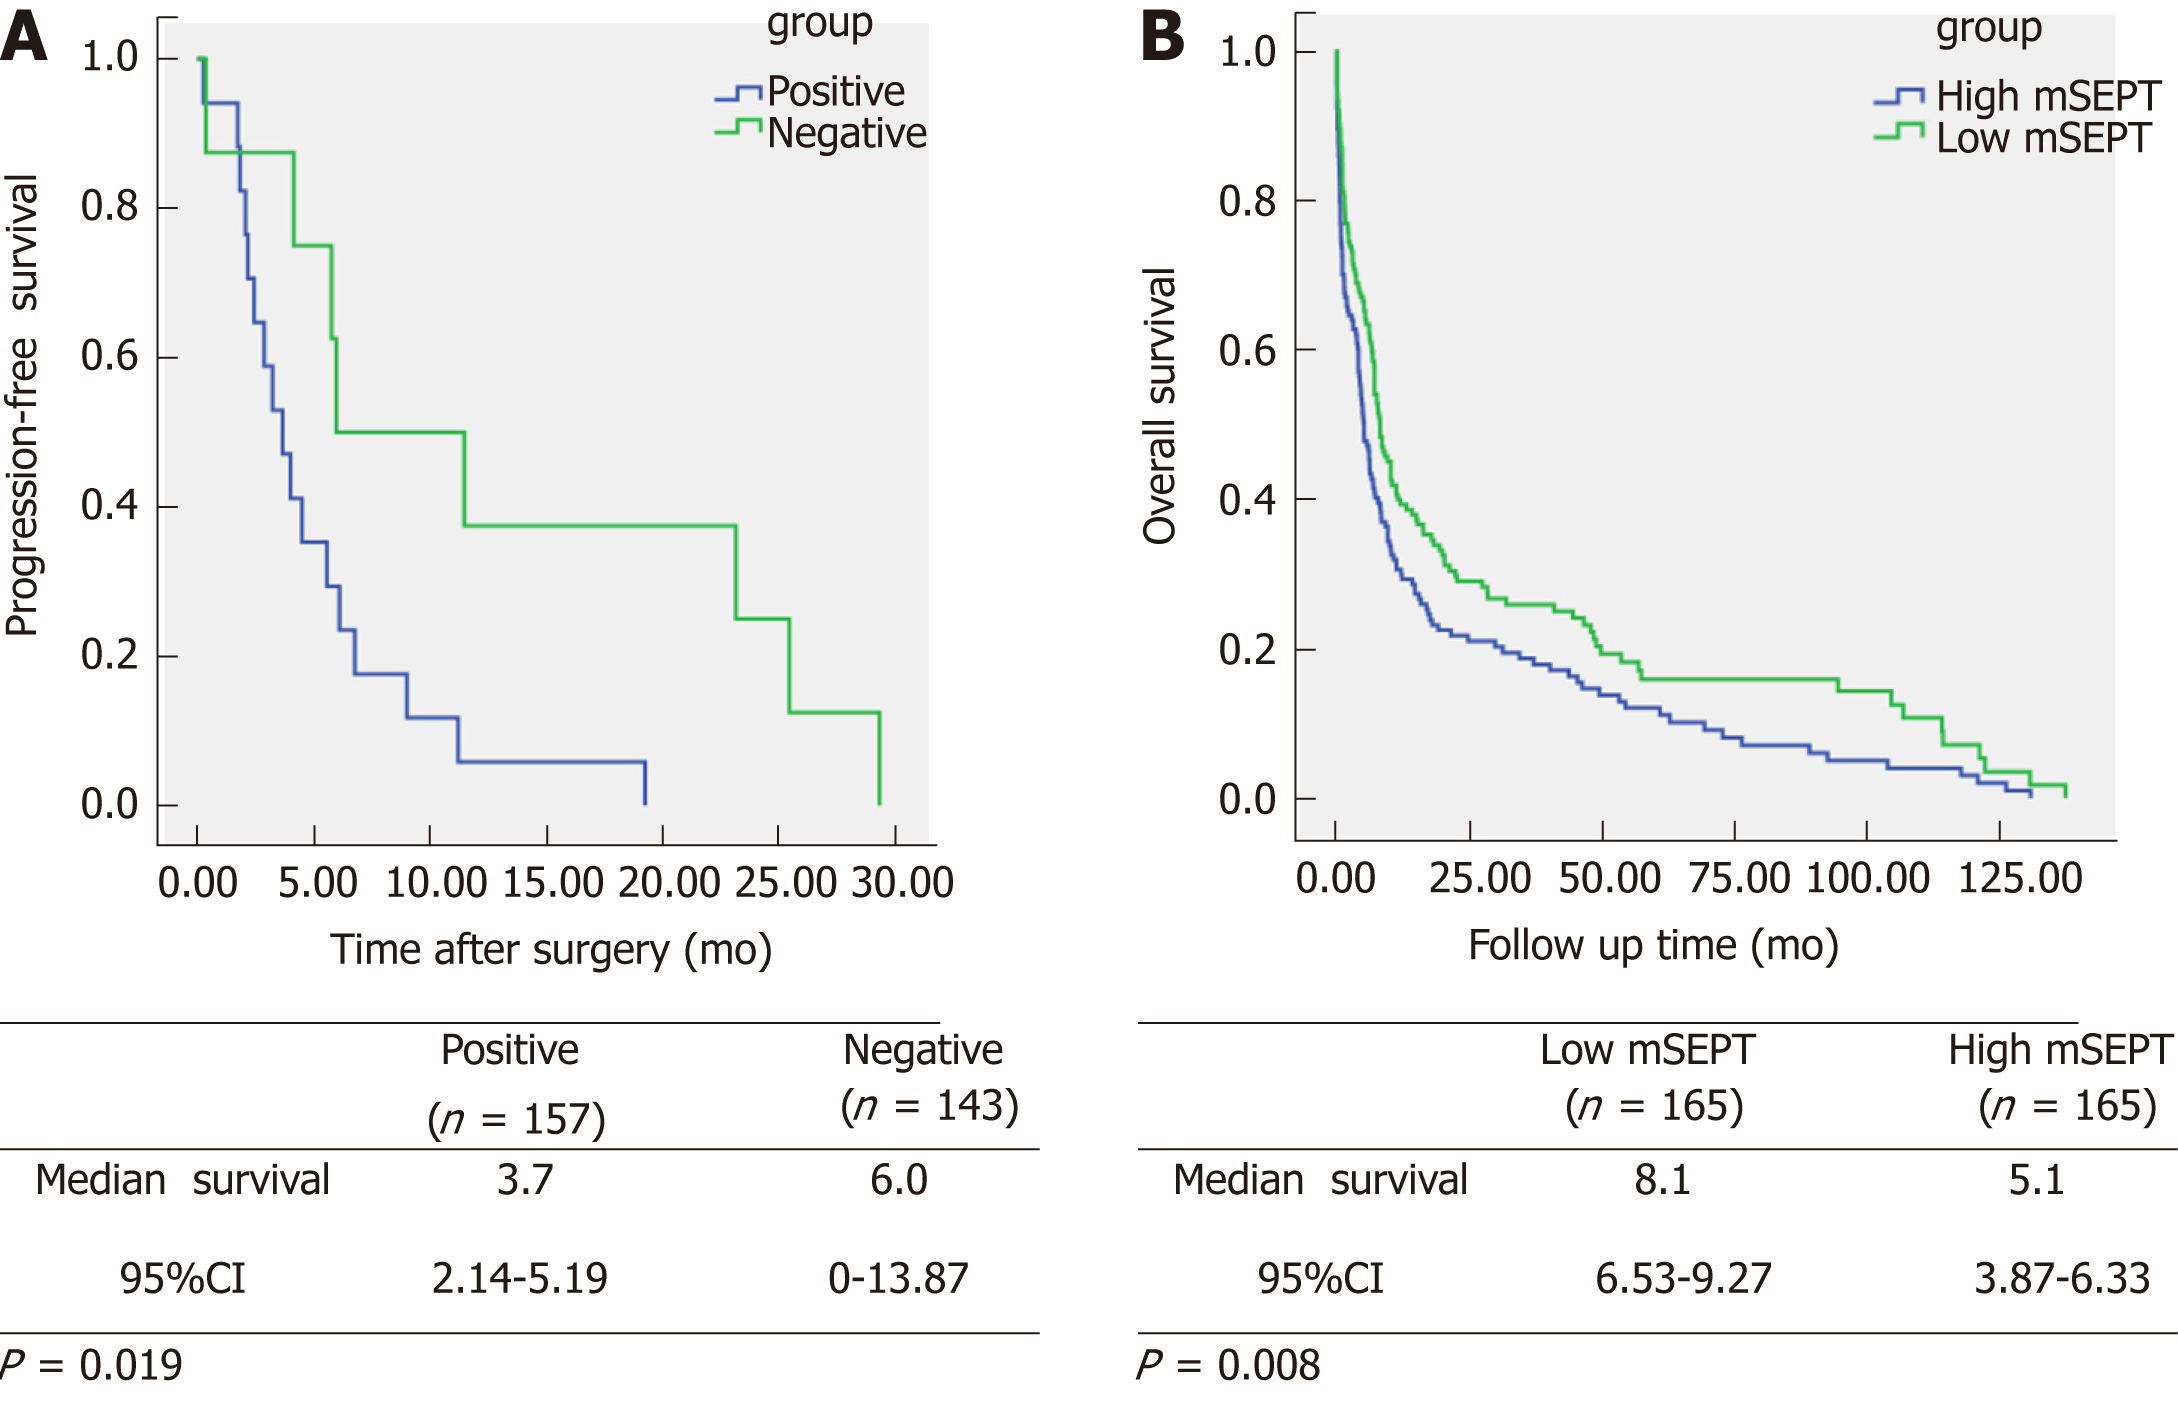
Figure 4 Kaplan-Meier univariate survival curves according to methylated septin 9 status.
A: Progression-free survival time; B: Overall survival. The statistical significance for difference of means shown in P values and Kaplan-Meier univariate analysis. mSEPT: Methylated septin; CI: Confidence interval.
- Citation: Yang X, Xu ZJ, Chen X, Zeng SS, Qian L, Wei J, Peng M, Wang X, Liu WL, Ma HY, Gong ZC, Yan YL. Clinical value of preoperative methylated septin 9 in Chinese colorectal cancer patients. World J Gastroenterol 2019; 25(17): 2099-2109
- URL: https://www.wjgnet.com/1007-9327/full/v25/i17/2099.htm
- DOI: https://dx.doi.org/10.3748/wjg.v25.i17.2099


