Copyright
©The Author(s) 2019.
World J Gastroenterol. May 7, 2019; 25(17): 2099-2109
Published online May 7, 2019. doi: 10.3748/wjg.v25.i17.2099
Published online May 7, 2019. doi: 10.3748/wjg.v25.i17.2099
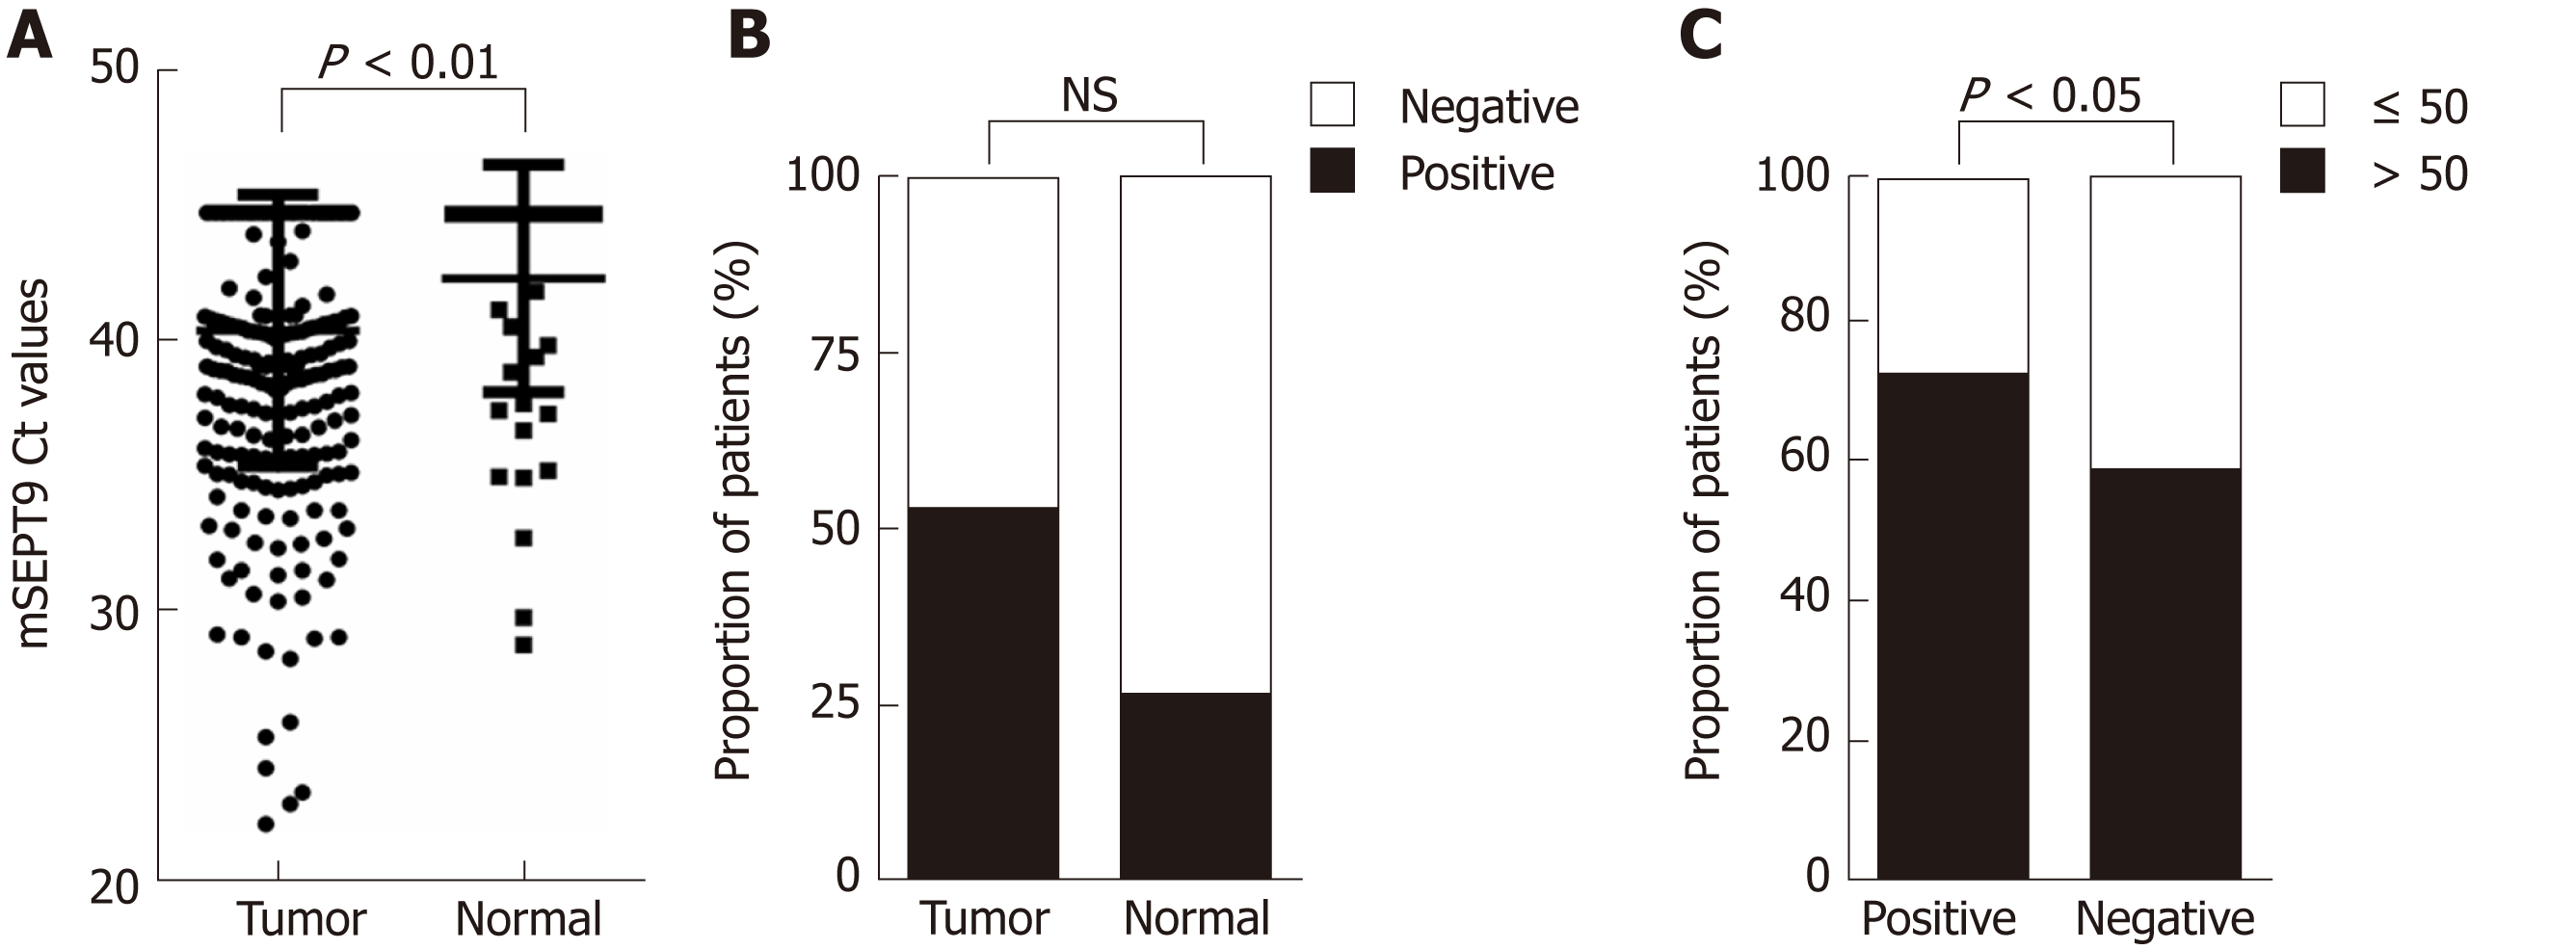
Figure 1 Graphical representations of difference in methylated septin 9 Ct values or proportion of patients between different groups.
A: Methylated septin 9 (mSEPT9) Ct values in tumor group and normal group; B: Proportion of patients with positive and negative mSEPT9 in tumor group and normal group; C: Proportion of patients older than 50 and aged 50 or younger in positive group and negative group. The statistical significance for difference of means is shown in P values, t-test, or χ2 test. mSEPT9: Methylated septin 9.
- Citation: Yang X, Xu ZJ, Chen X, Zeng SS, Qian L, Wei J, Peng M, Wang X, Liu WL, Ma HY, Gong ZC, Yan YL. Clinical value of preoperative methylated septin 9 in Chinese colorectal cancer patients. World J Gastroenterol 2019; 25(17): 2099-2109
- URL: https://www.wjgnet.com/1007-9327/full/v25/i17/2099.htm
- DOI: https://dx.doi.org/10.3748/wjg.v25.i17.2099


