Copyright
©The Author(s) 2019.
World J Gastroenterol. Apr 28, 2019; 25(16): 1997-2009
Published online Apr 28, 2019. doi: 10.3748/wjg.v25.i16.1997
Published online Apr 28, 2019. doi: 10.3748/wjg.v25.i16.1997
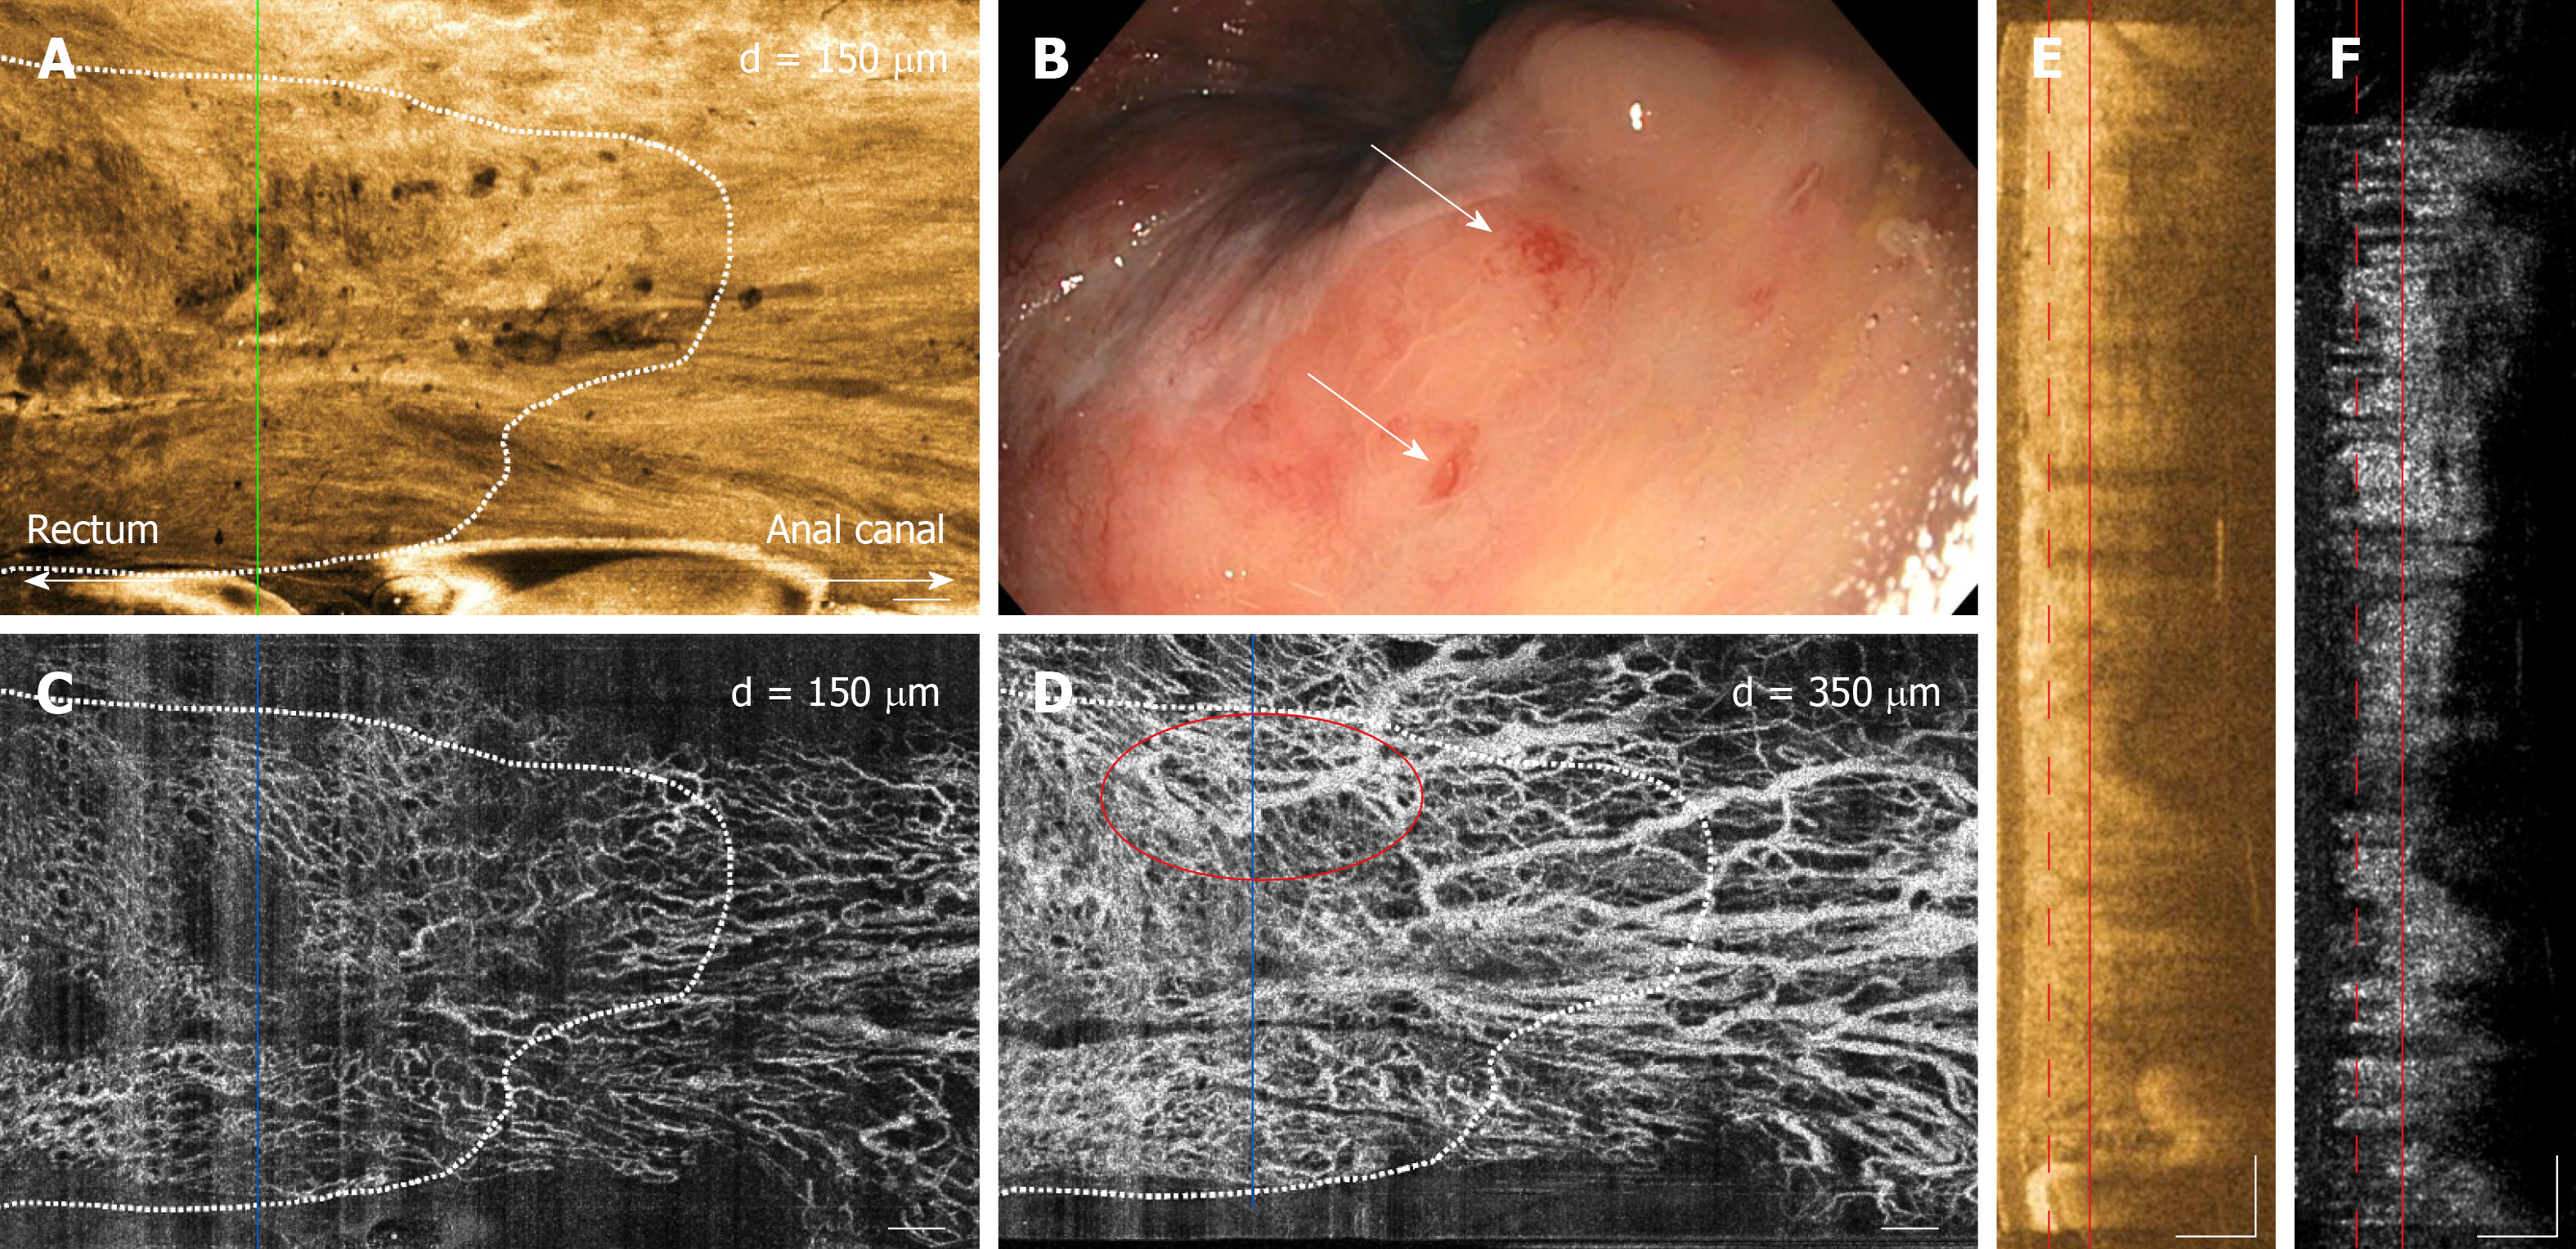
Figure 3 Depth-resolved en face optical coherence tomography and optical coherence tomography angiography images, cross-sectional optical coherence tomography and optical coherence tomography angiography images, and corresponding endoscopy image over the dentate line of a previously-treated chronic radiation proctopathy patient.
A: En face optical coherence tomography (OCT) image at 150 μm depth showing regular circular mucosal patterns on the rectal side and squamous epithelium with a smooth appearance on the anal canal side; B: Shows the corresponding endoscopy image at the dentate line showing some residual telangiectatic areas (arrows, rectal telangiectasia density = 1); C: En face OCT angiography (OCTA) image at 150 µm depth showing regular honeycomb-like microvascular pattern in the mucosal layer; D: En face OCTA image at 350 μm depth showing vessels with heterogonous and unusually large diameters (red oval) suggesting presence of abnormal arterioles and venules in the submucosal layer; E: Cross-sectional OCT image from the solid green line in A showing mucosal and submucosal layers; F: Cross-sectional OCTA image from the solid blue lines in C and D. Cross-sectional OCTA image was averaged over a 50 μm projection range in the longitudinal direction to improve contrast and reduce noise. Dashed and solid lines in E and F indicate 150 μm and 350 μm depth levels, respectively. Scale bars are 1 mm in A-D, 500 μm in E and F. OCT: Optical coherence tomography; OCTA: Optical coherence tomography angiography.
- Citation: Ahsen OO, Liang K, Lee HC, Wang Z, Fujimoto JG, Mashimo H. Assessment of chronic radiation proctopathy and radiofrequency ablation treatment follow-up with optical coherence tomography angiography: A pilot study. World J Gastroenterol 2019; 25(16): 1997-2009
- URL: https://www.wjgnet.com/1007-9327/full/v25/i16/1997.htm
- DOI: https://dx.doi.org/10.3748/wjg.v25.i16.1997


