Copyright
©The Author(s) 2019.
World J Gastroenterol. Apr 28, 2019; 25(16): 1997-2009
Published online Apr 28, 2019. doi: 10.3748/wjg.v25.i16.1997
Published online Apr 28, 2019. doi: 10.3748/wjg.v25.i16.1997
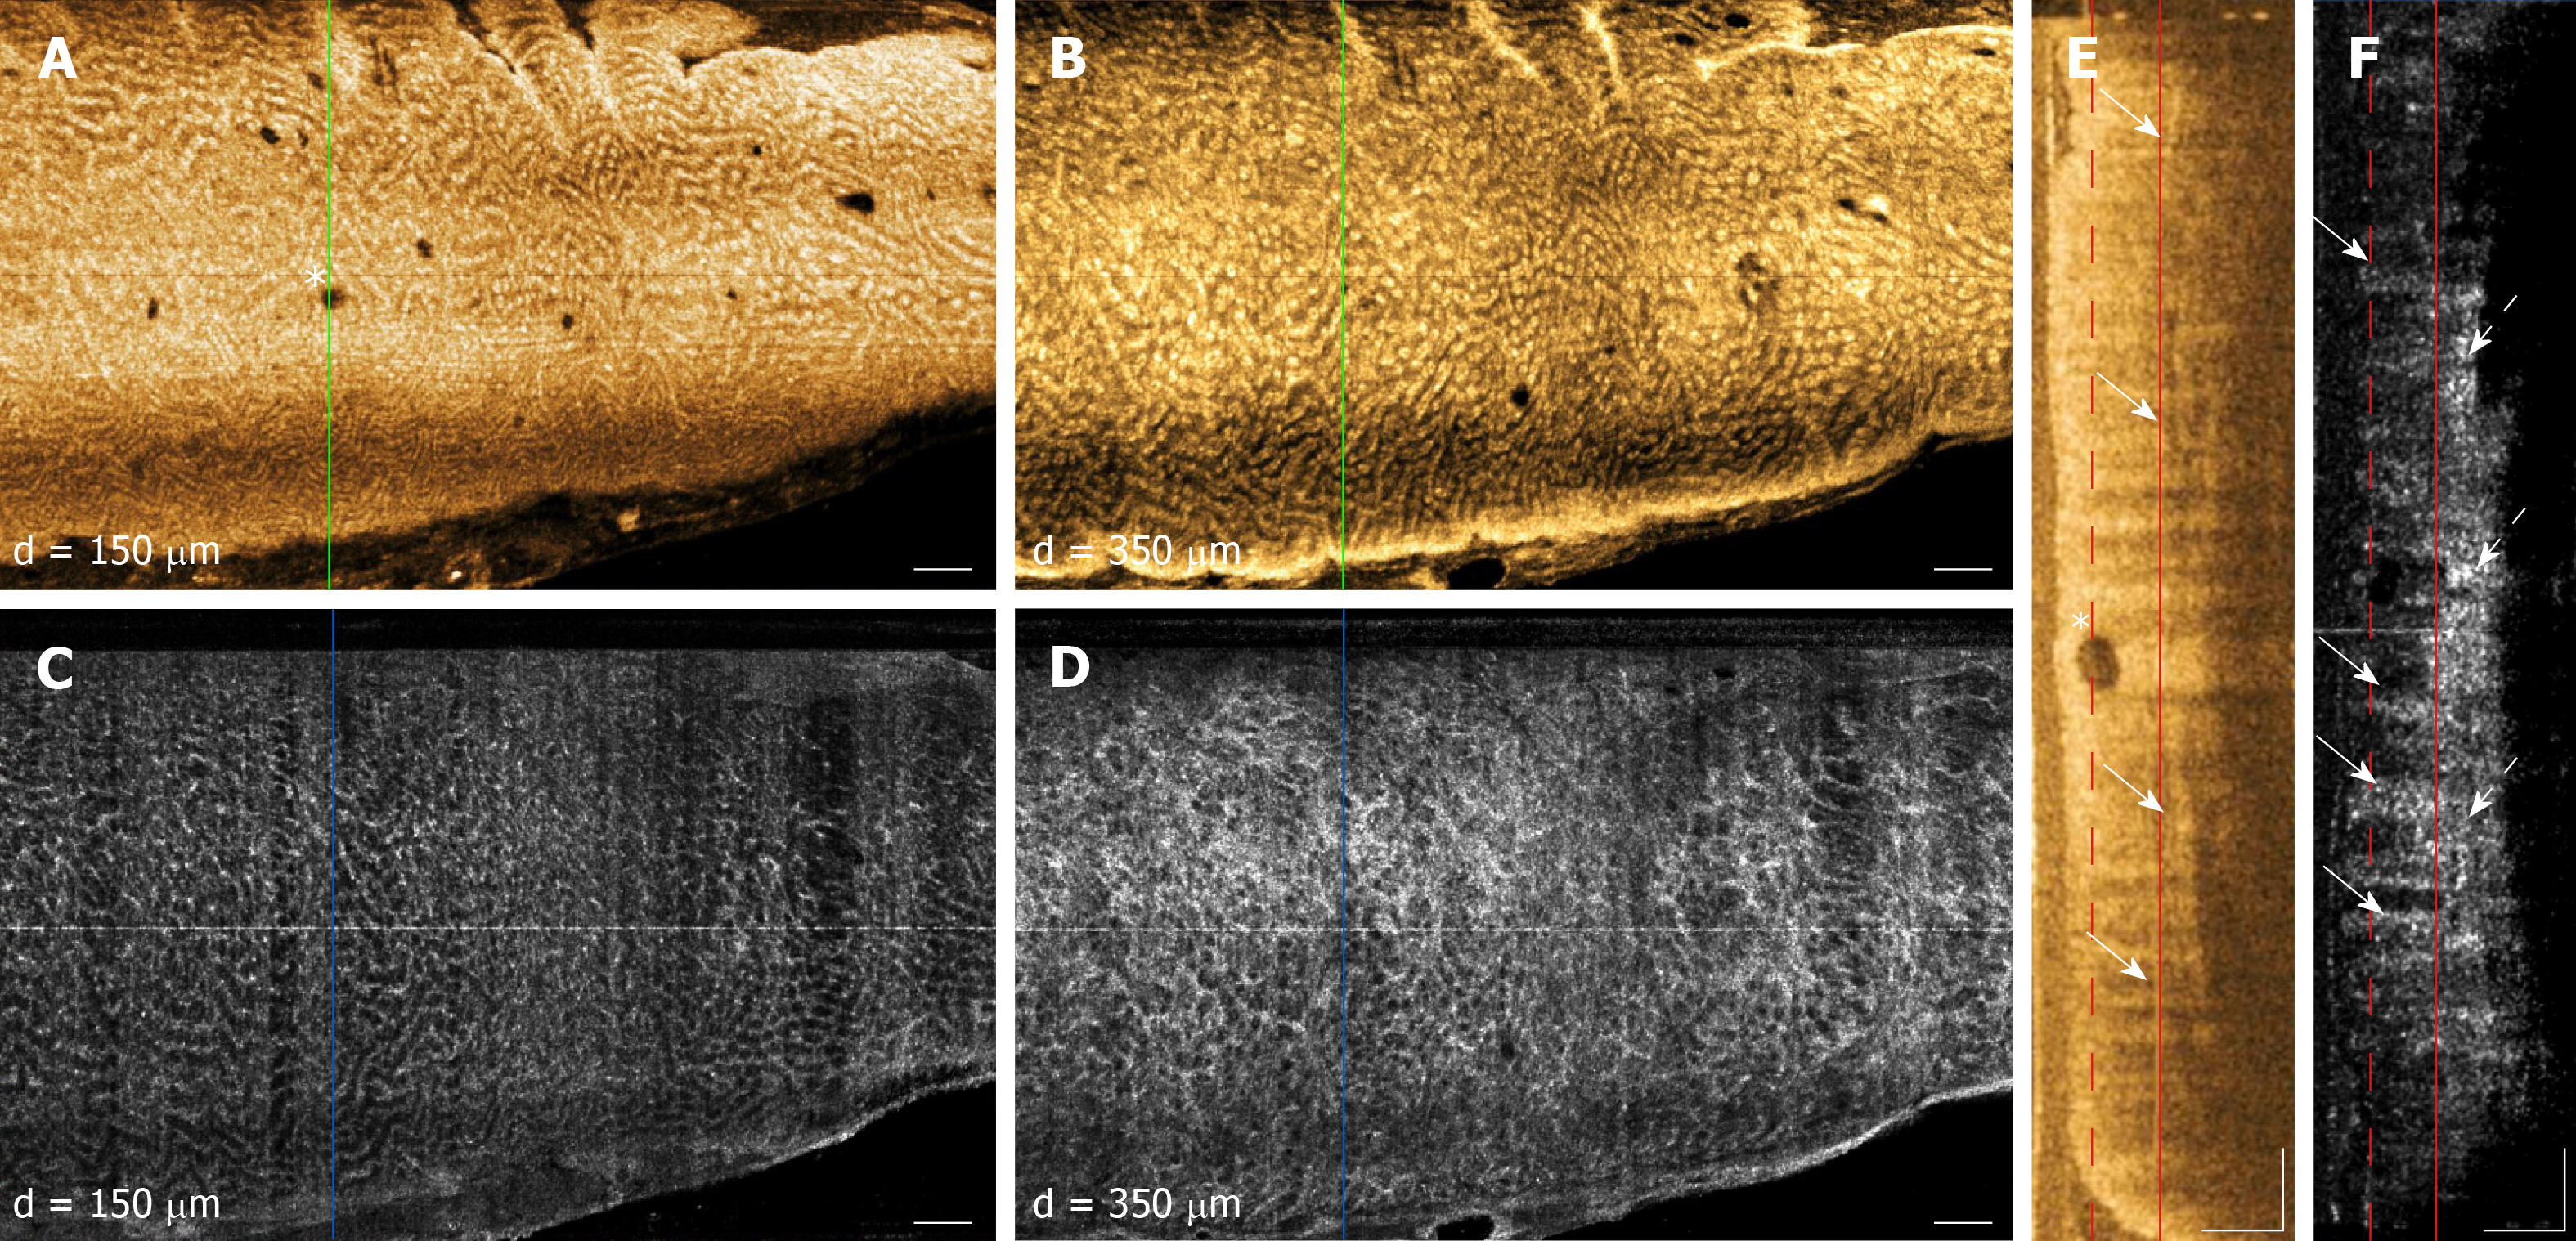
Figure 1 Depth-resolved en face optical coherence tomography and optical coherence tomography angiography images and cross-sectional optical coherence tomography and optical coherence tomography angiography images of a normal rectum.
A: En face optical coherence tomography (OCT) image at 150 μm depth; B: En face OCT at 350 μm depth showing regular circular mucosal patterns characteristics of normal rectum; C: En face OCT angiography (OCTA) image at 150 μm depth showing regular honeycomb-like microvascular pattern of the subsurface capillary network in the mucosal layer; D: En face OCTA image at 350 μm depth showing rectal microvasculature corresponding to arterioles and venules in the submucosal layer, in addition to shadowing from the superficial mucosal microvasculature; E: Cross-sectional OCT image from the solid green lines in A and B, showing regular columnar architecture of normal rectum. The submucosal layer can be identified by the vertical layers traversing across the image (arrows). A dilated mucosal gland can be observed in both en face and cross-sectional image (asterisk); F: Cross-sectional OCTA image from the solid blue lines in C and D. Subsurface capillaries in the mucosal layer can be identified as horizontal structures connecting submucosal layer to the mucosal layer (solid arrows), while the arterioles and venules can be identified as vertical structures in the submucosal layer traversing across the images (dashed arrows). Cross-sectional OCTA image was averaged over a 50 µm projection range in the longitudinal direction to improve contrast and reduce noise. Dashed and solid lines in E and F indicate 150 μm and 350 μm depth levels, respectively. Scale bars are 1 mm in A-D, 500 μm in E and F. OCT: Optical coherence tomography; OCTA: Optical coherence tomography angiography.
- Citation: Ahsen OO, Liang K, Lee HC, Wang Z, Fujimoto JG, Mashimo H. Assessment of chronic radiation proctopathy and radiofrequency ablation treatment follow-up with optical coherence tomography angiography: A pilot study. World J Gastroenterol 2019; 25(16): 1997-2009
- URL: https://www.wjgnet.com/1007-9327/full/v25/i16/1997.htm
- DOI: https://dx.doi.org/10.3748/wjg.v25.i16.1997


