Copyright
©The Author(s) 2019.
World J Gastroenterol. Apr 21, 2019; 25(15): 1840-1853
Published online Apr 21, 2019. doi: 10.3748/wjg.v25.i15.1840
Published online Apr 21, 2019. doi: 10.3748/wjg.v25.i15.1840
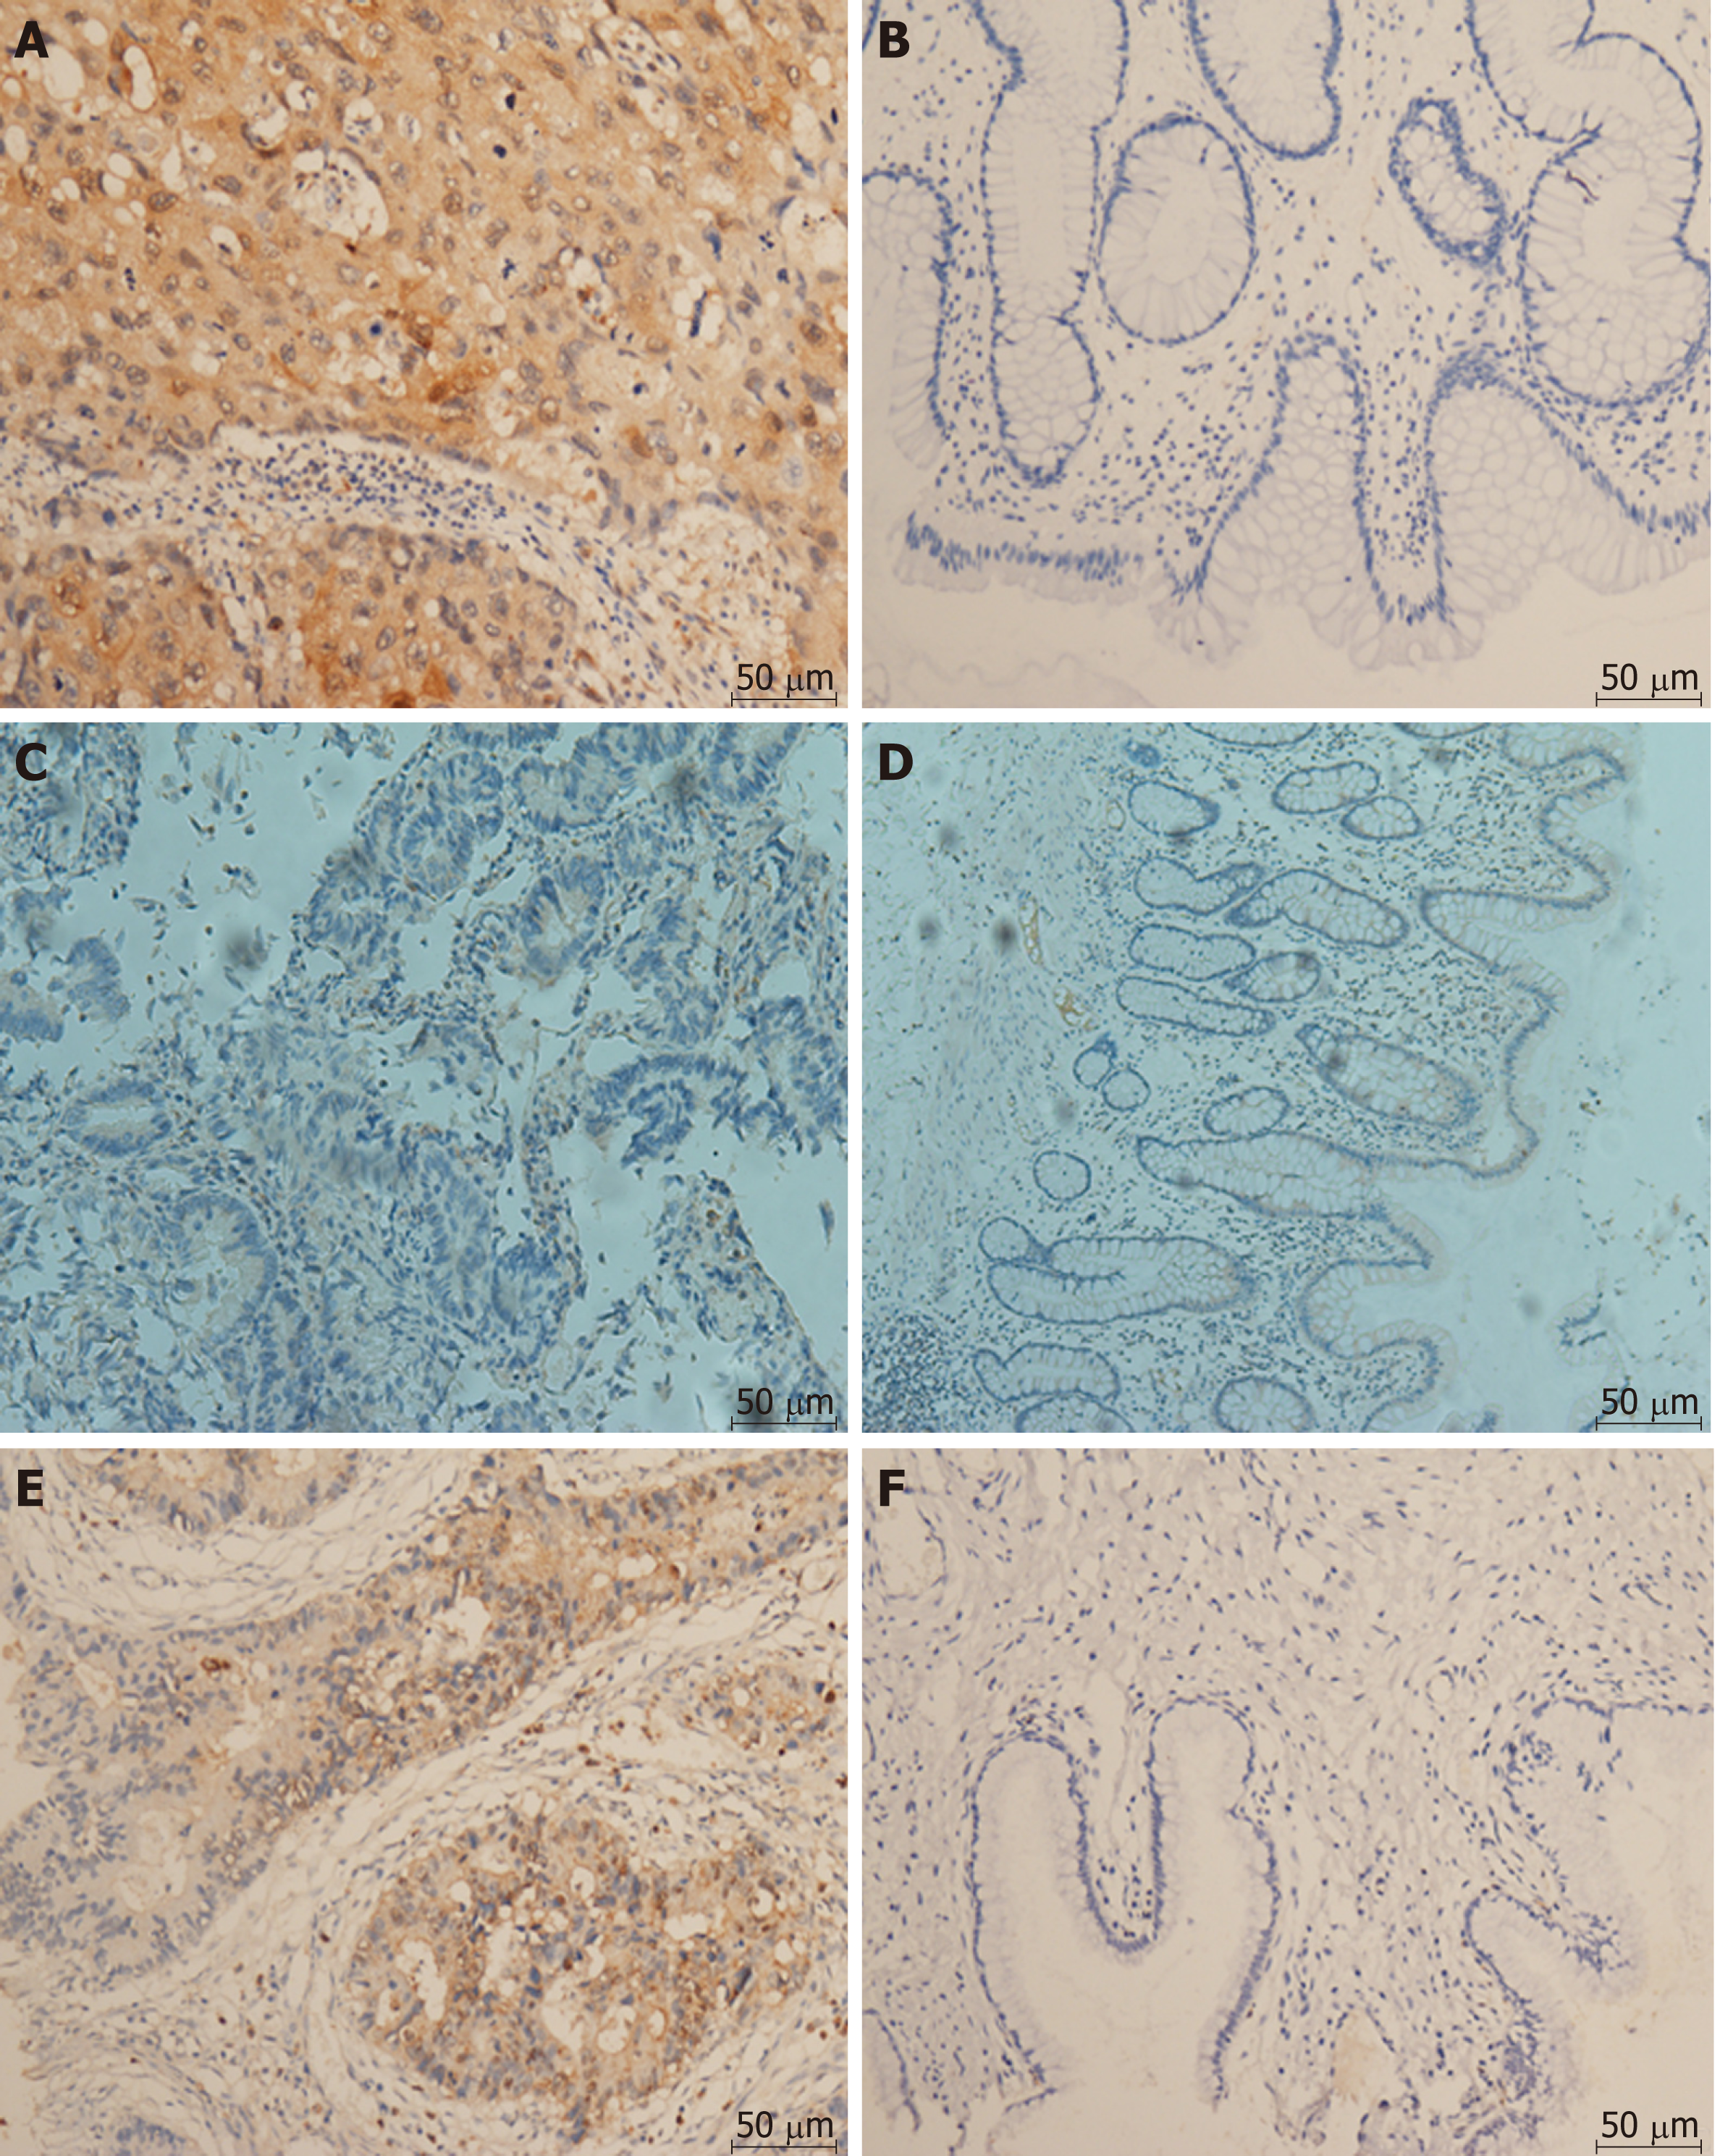
Figure 2 Immunohistochemical staining (200×).
A: LC3 displayed strong cytoplasm staining in colorectal cancer tissue; B: LC3 displayed weak cytoplasm staining in normal tissue; C: Beclin1 displayed strong cytoplasm staining in colorectal cancer tissue; D: Beclin1 displayed weak cytoplasm staining in normal tissue; E: 4E-BP1 displayed strong cytoplasm staining in colorectal cancer tissue; F: 4E-BP1 displayed weak cytoplasm staining in normal tissue.
- Citation: Guo GF, Wang YX, Zhang YJ, Chen XX, Lu JB, Wang HH, Jiang C, Qiu HQ, Xia LP. Predictive and prognostic implications of 4E-BP1, Beclin-1, and LC3 for cetuximab treatment combined with chemotherapy in advanced colorectal cancer with wild-type KRAS: Analysis from real-world data. World J Gastroenterol 2019; 25(15): 1840-1853
- URL: https://www.wjgnet.com/1007-9327/full/v25/i15/1840.htm
- DOI: https://dx.doi.org/10.3748/wjg.v25.i15.1840


