Copyright
©The Author(s) 2019.
World J Gastroenterol. Mar 21, 2019; 25(11): 1355-1365
Published online Mar 21, 2019. doi: 10.3748/wjg.v25.i11.1355
Published online Mar 21, 2019. doi: 10.3748/wjg.v25.i11.1355
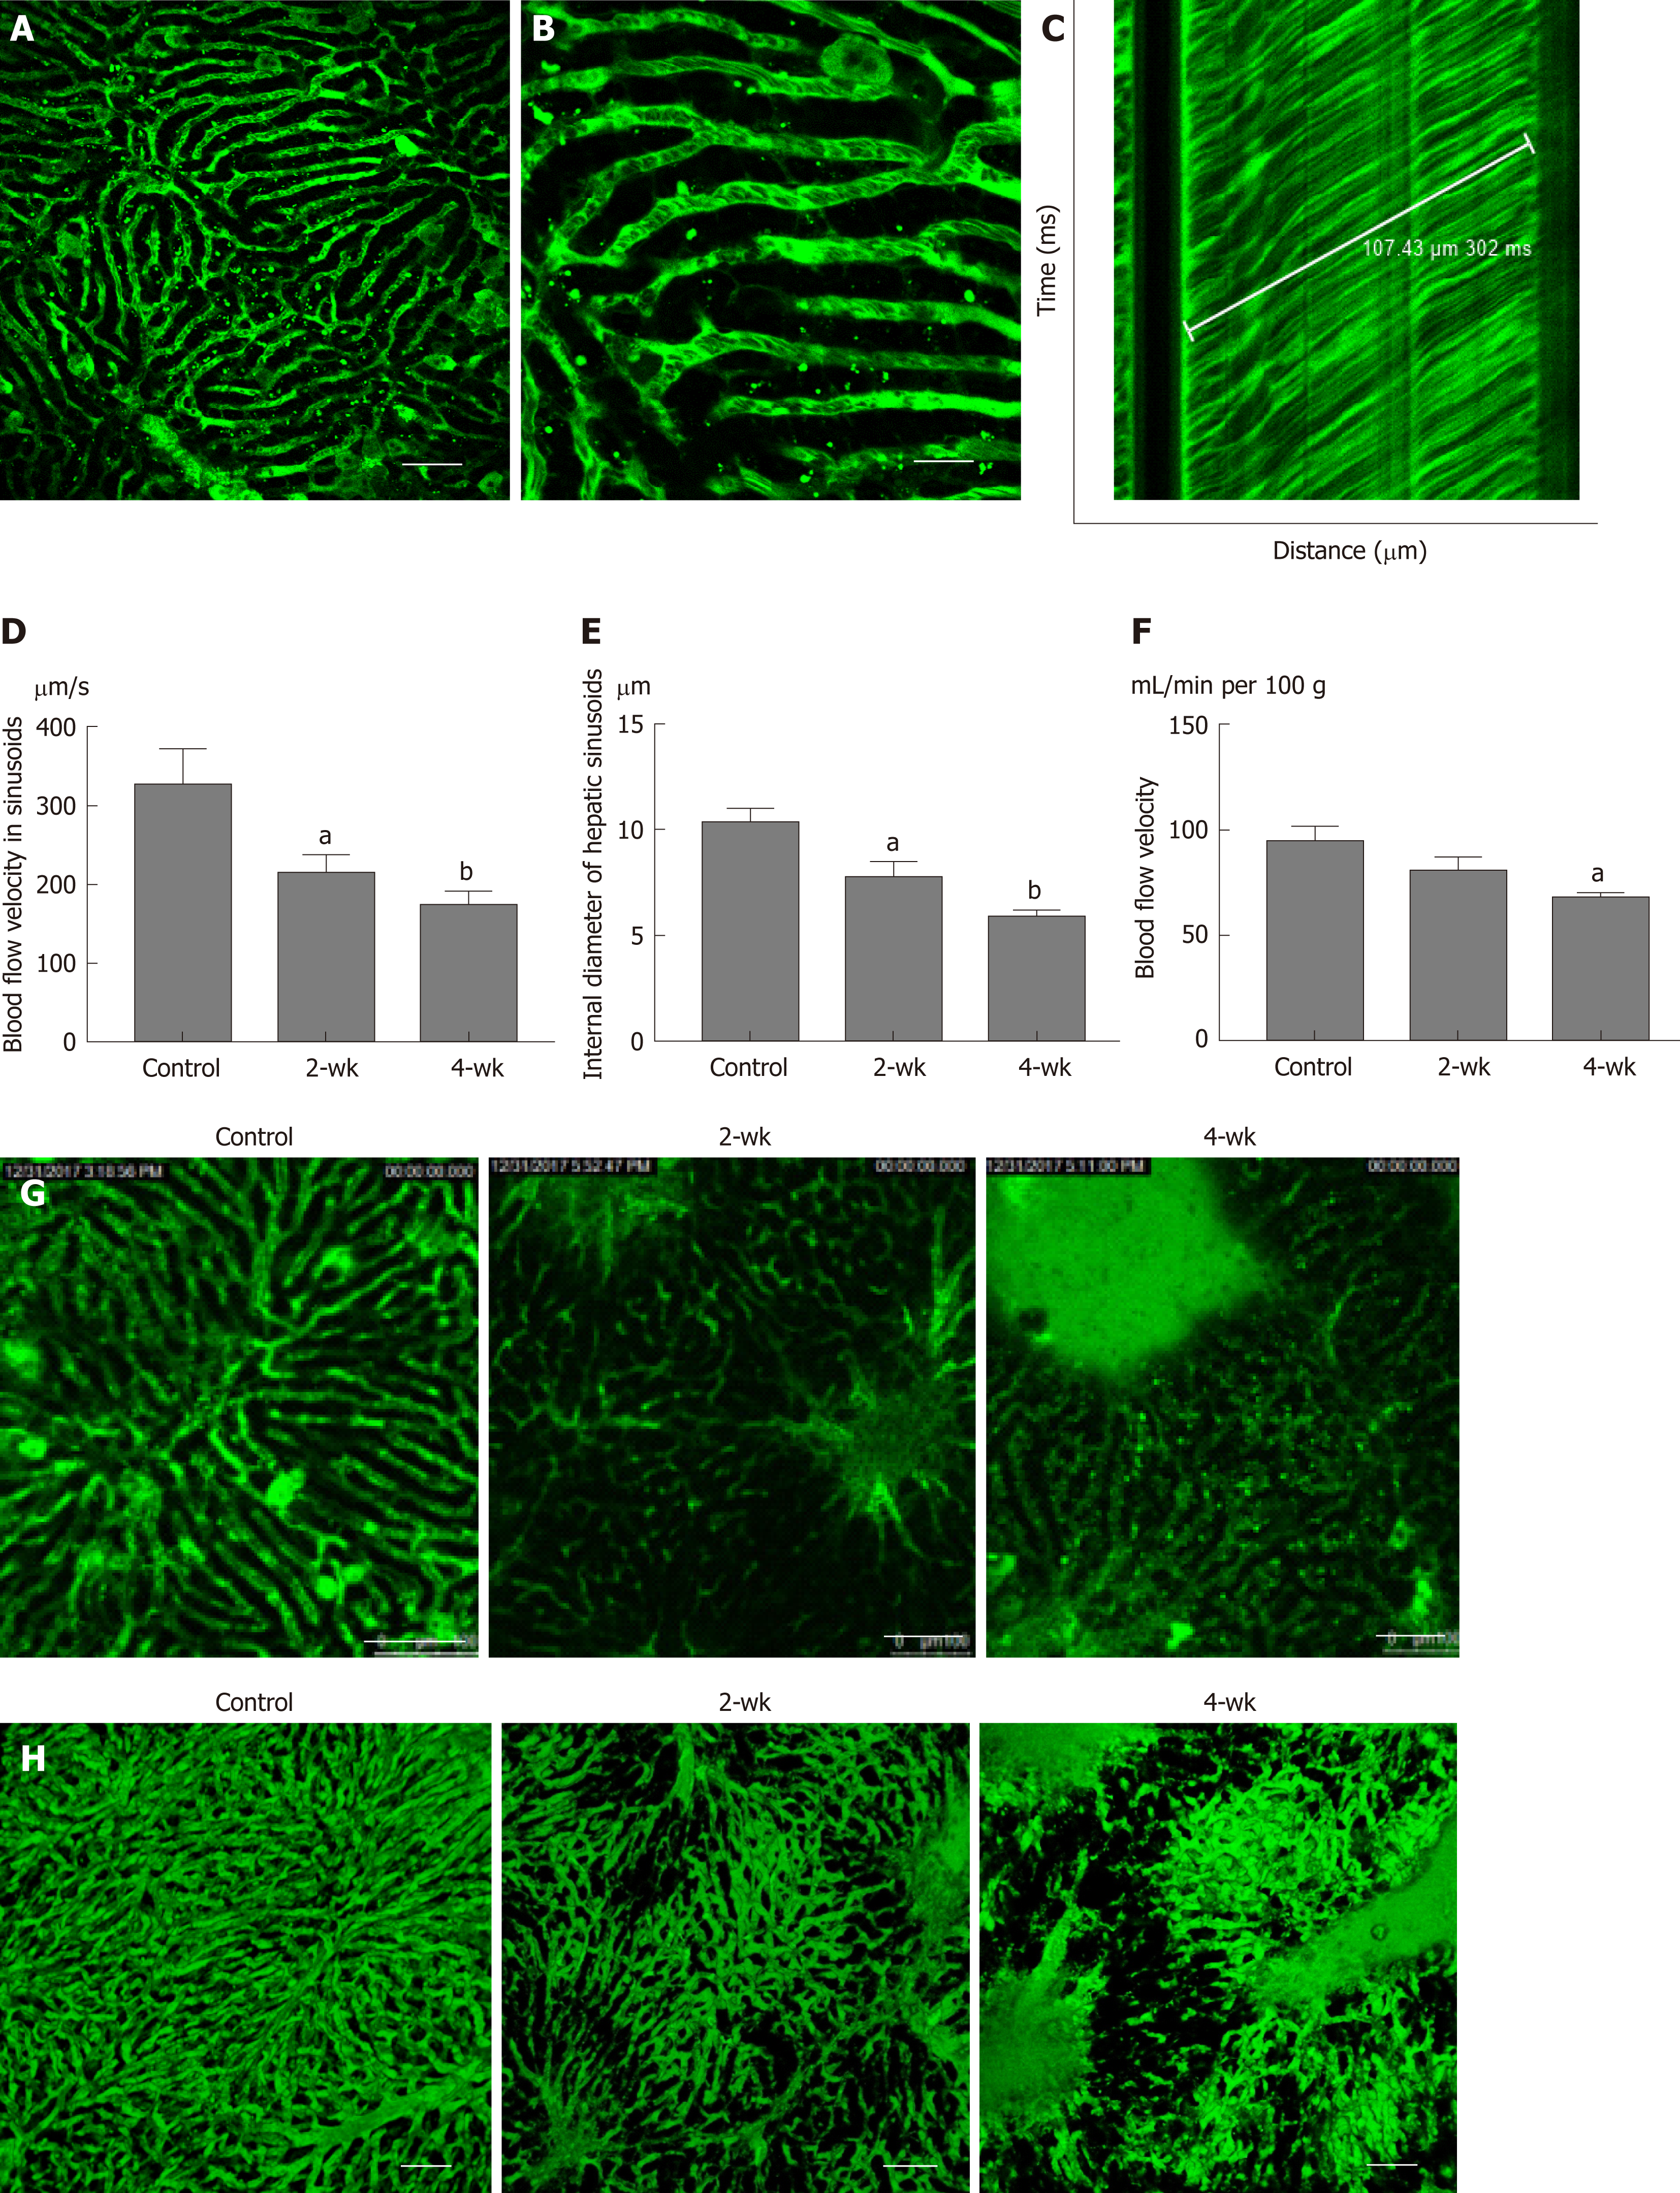
Figure 4 Changes of blood flow in the sinusoid after CCl4 treatment.
A: After the injection of fluorescent dye, the mouse liver tissue structure was observed under a two-photon fluorescence microscope. The green luminescent area represents the liver sinusoid. Scale bar refers to 100 μm. B: On enlarging the image of the sinusoid, the darker dots appeared in the sinusoids, which represent red blood cells. Scale bar refers to 30 μm. C: The distance-time image was obtained by scanning with the two-photon laser scanning microscope, and the blood flow velocity of the liver was calculated based on the image. D-F: The blood flow velocity in the hepatic sinusoid, the internal sinusoidal diameter, and the velocity of blood flow in the superficial blood vessels of the liver were estimated in all three groups. After treatment with CCl4, the blood flow velocity both in the sinusoid and superficial blood vessels decreased significantly. The internal sinusoidal diameter also decreased. G: In the control group, hepatic sinusoid morphology was uniform, while in the 2-wk and the 4-wk groups, the shapes of the sinusoids were significantly zigzag and the internal diameters were significantly less than the average diameter. Scale bar refers to 100 μm. H: The 3D image of the hepatic sinusoids. aP < 0.05 vs control, bP < 0.01 vs control.
- Citation: Fan J, Chen CJ, Wang YC, Quan W, Wang JW, Zhang WG. Hemodynamic changes in hepatic sinusoids of hepatic steatosis mice. World J Gastroenterol 2019; 25(11): 1355-1365
- URL: https://www.wjgnet.com/1007-9327/full/v25/i11/1355.htm
- DOI: https://dx.doi.org/10.3748/wjg.v25.i11.1355


