Copyright
©The Author(s) 2019.
World J Gastroenterol. Mar 21, 2019; 25(11): 1289-1306
Published online Mar 21, 2019. doi: 10.3748/wjg.v25.i11.1289
Published online Mar 21, 2019. doi: 10.3748/wjg.v25.i11.1289
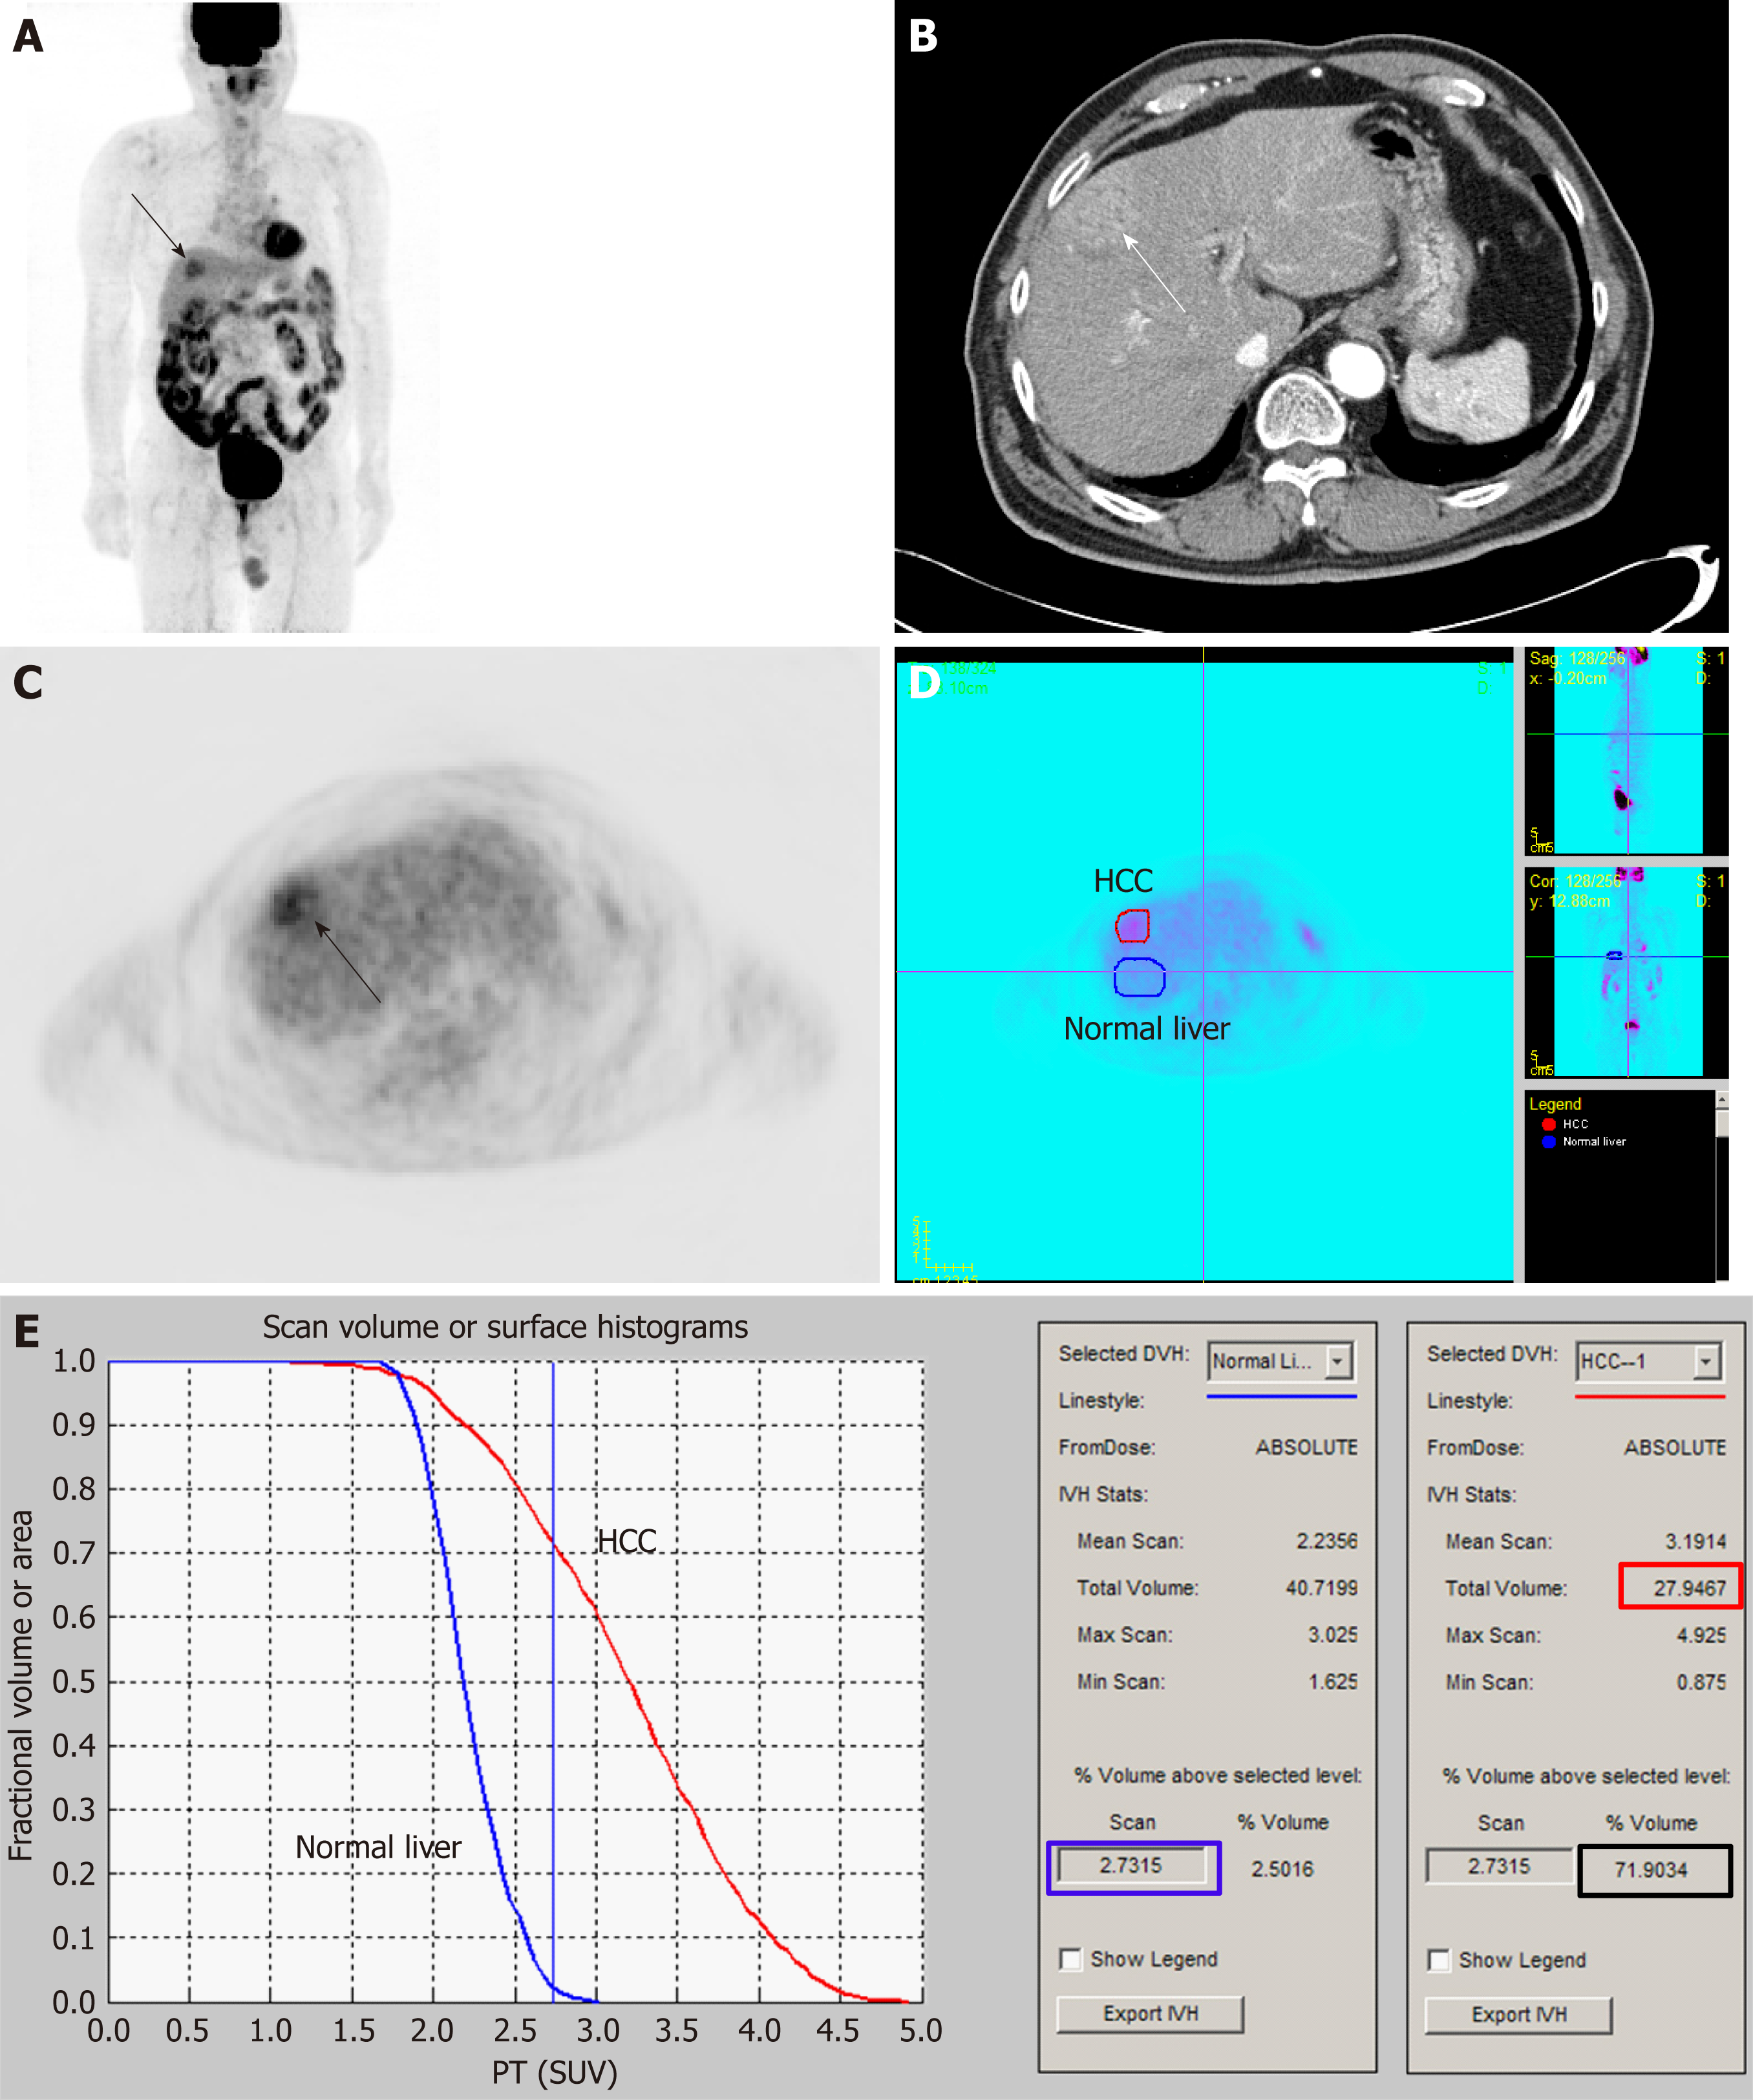
Figure 1 An example of the method for measuring metabolic tumor volume based on intensity-volume histogram from reference[88] with permission.
Maximal intensity projection (A) and transaxial image (C) of 18F-fluorodexoyglucose (FDG) positron emission tomography (PET) and contrast-enhanced computed tomography image (B) showed a single hepatocellular carcinoma (HCC) with moderately increased FDG uptake. Regions of interest of HCC (red) and normal liver tissue (blue) are manually drawn on transaxial PET images (D). Cumulative intensity-volume histogram plots for HCC (red) and normal liver tissue (blue) are calculated from regions of interest. Standardized uptake value of the 97.5th percentile of the voxels of the normal liver tissue was 2.7 (blue box) and the fraction of the tumor volume with ≥ 2.7 was 71.9% (black box). As the total tumor volume was 27.9 cm3 (red box), sum of the tumor voxels over the standardized uptake value of the 97.5th percentile of the normal liver tissue voxels of the patient was 20.1 cm3. HCC: Hepatocellular carcinoma; SUV: Standardized uptake value.
- Citation: Lee SM, Kim HS, Lee S, Lee JW. Emerging role of 18F-fluorodeoxyglucose positron emission tomography for guiding management of hepatocellular carcinoma. World J Gastroenterol 2019; 25(11): 1289-1306
- URL: https://www.wjgnet.com/1007-9327/full/v25/i11/1289.htm
- DOI: https://dx.doi.org/10.3748/wjg.v25.i11.1289


