Copyright
©The Author(s) 2018.
World J Gastroenterol. Feb 28, 2018; 24(8): 929-940
Published online Feb 28, 2018. doi: 10.3748/wjg.v24.i8.929
Published online Feb 28, 2018. doi: 10.3748/wjg.v24.i8.929
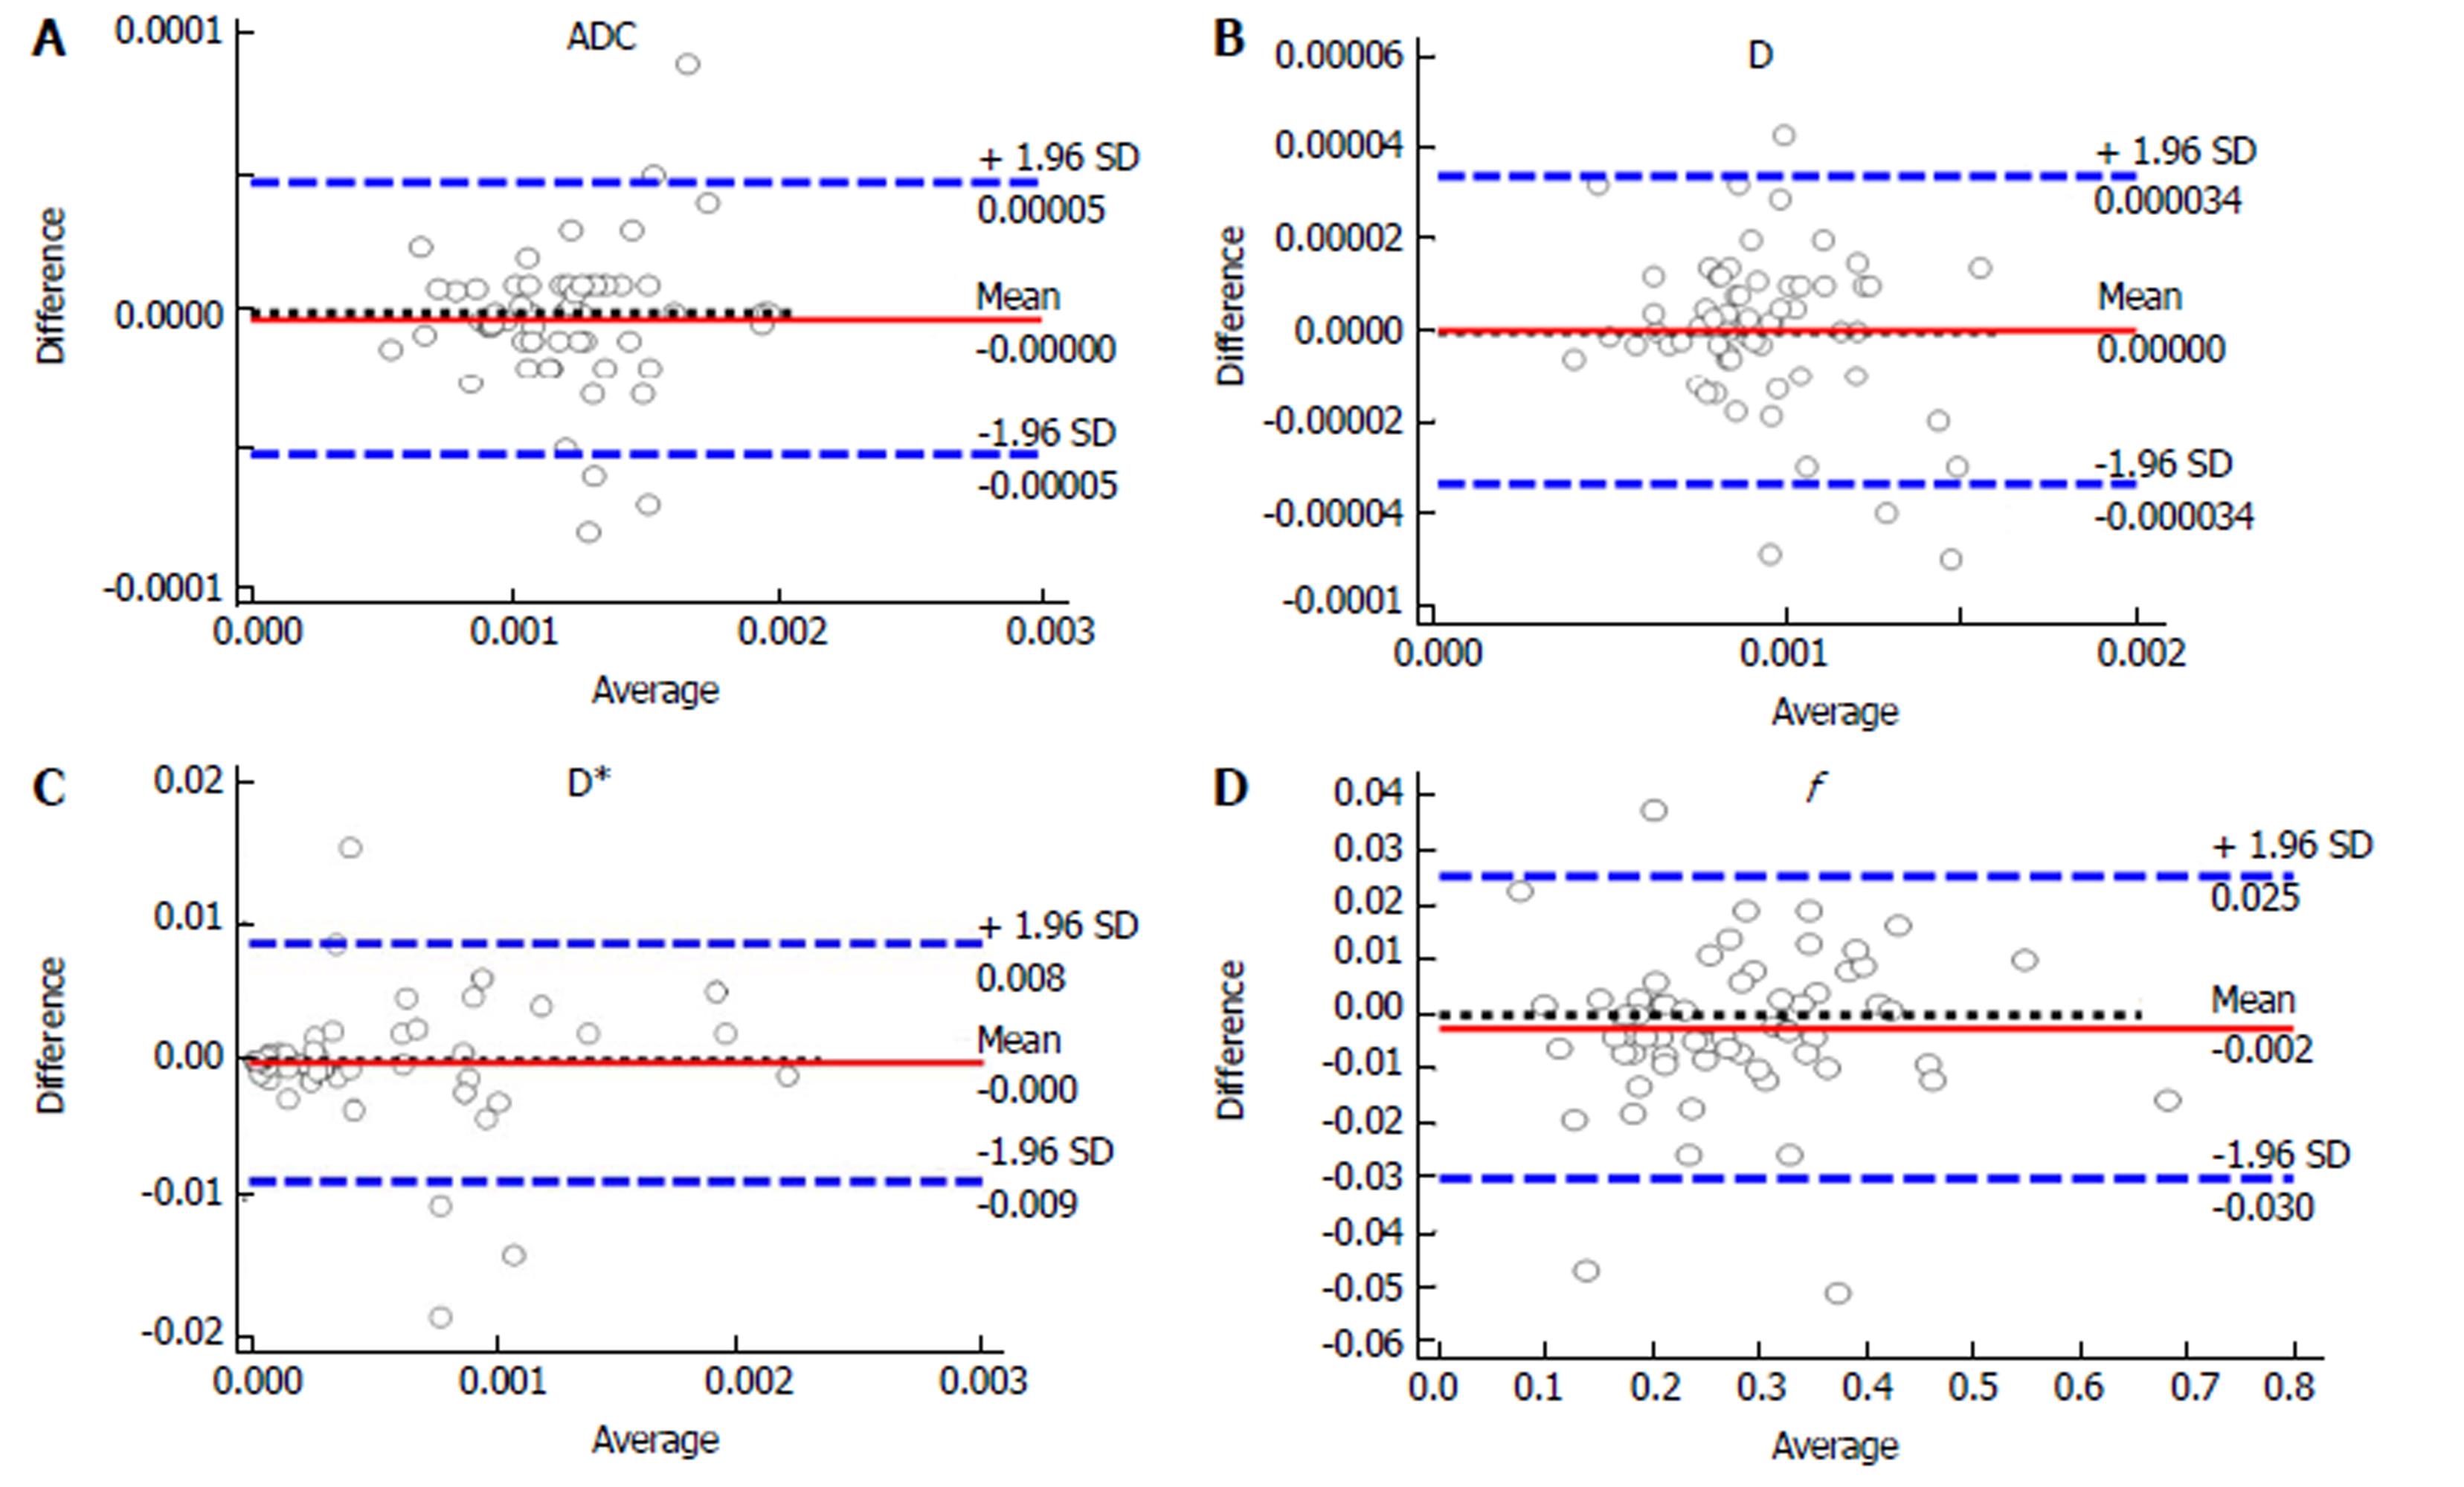
Figure 6 Bland-Altman plots showing the distribution of the differences of the intravoxel incoherent motion diffusion-weighted imaging and conventional diffusion-weighted imaging parameters between the two radiologists.
A-D: The distribution of the differences of the ADC, D, D*, and f values, respectively. The differences between measurements by the two radiologists regarding the parameters were relatively small. ±1.95 SD indicates 95% limits of agreement, mean, and mean difference, ADC: Apparent diffusion coefficient.
- Citation: Zhu SC, Liu YH, Wei Y, Li LL, Dou SW, Sun TY, Shi DP. Intravoxel incoherent motion diffusion-weighted magnetic resonance imaging for predicting histological grade of hepatocellular carcinoma: Comparison with conventional diffusion-weighted imaging. World J Gastroenterol 2018; 24(8): 929-940
- URL: https://www.wjgnet.com/1007-9327/full/v24/i8/929.htm
- DOI: https://dx.doi.org/10.3748/wjg.v24.i8.929


