
















©The Author(s) 2018.
World J Gastroenterol. Feb 21, 2018; 24(7): 775-793
Published online Feb 21, 2018. doi: 10.3748/wjg.v24.i7.775
Published online Feb 21, 2018. doi: 10.3748/wjg.v24.i7.775
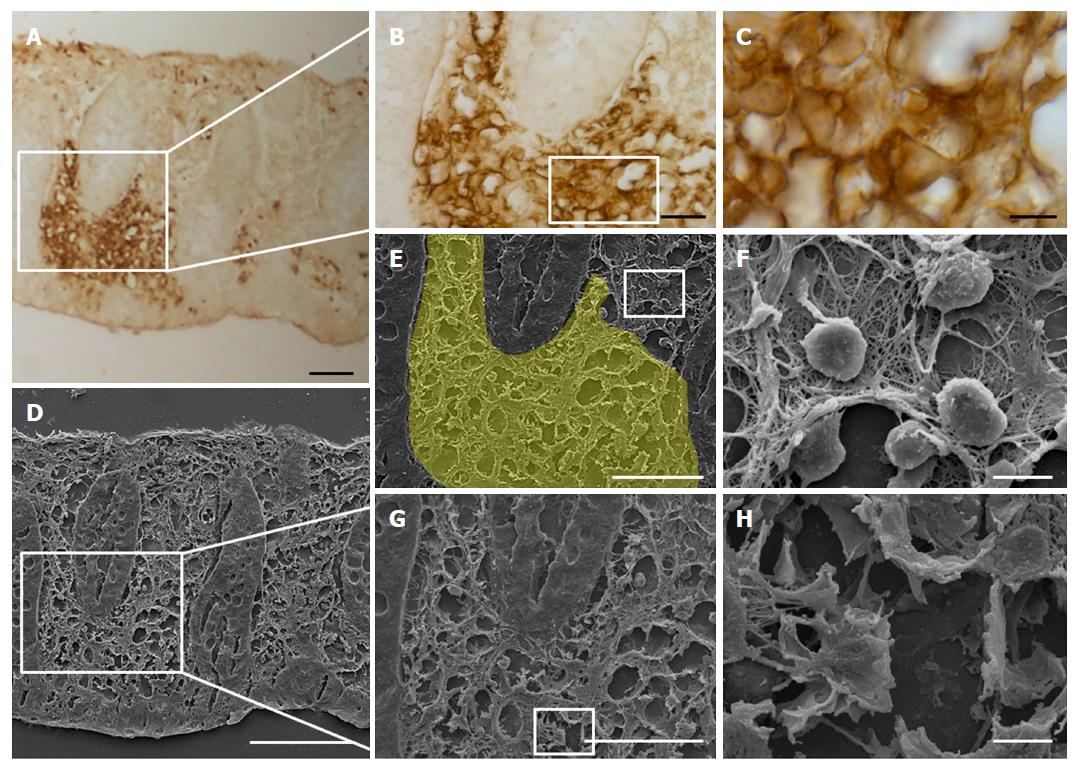
Figure 8 Light (A-C) and scanning electron (D-H) microscopy images of a sample of descending colon with non-inflamed mucosa after immunoperoxidase GLUT5 staining from a UC patient.
The boxed areas in (A) and (D) are corresponding areas and are shown enlarged in (B) and (G), respectively. The yellow area in (E) represents the immunostaining area shown in (B). The boxed area in (B, E, G) is shown at higher magnification in (C, F, H, respectively). Scale bar: (D) 100 μm ; (A, E, G) 50 μm; (B) 25 μm; (C, F, H) 5 μm.
- Citation: Merigo F, Brandolese A, Facchin S, Missaggia S, Bernardi P, Boschi F, D’Incà R, Savarino EV, Sbarbati A, Sturniolo GC. Glucose transporter expression in the human colon. World J Gastroenterol 2018; 24(7): 775-793
- URL: https://www.wjgnet.com/1007-9327/full/v24/i7/775.htm
- DOI: https://dx.doi.org/10.3748/wjg.v24.i7.775