Copyright
©The Author(s) 2018.
World J Gastroenterol. Feb 21, 2018; 24(7): 775-793
Published online Feb 21, 2018. doi: 10.3748/wjg.v24.i7.775
Published online Feb 21, 2018. doi: 10.3748/wjg.v24.i7.775
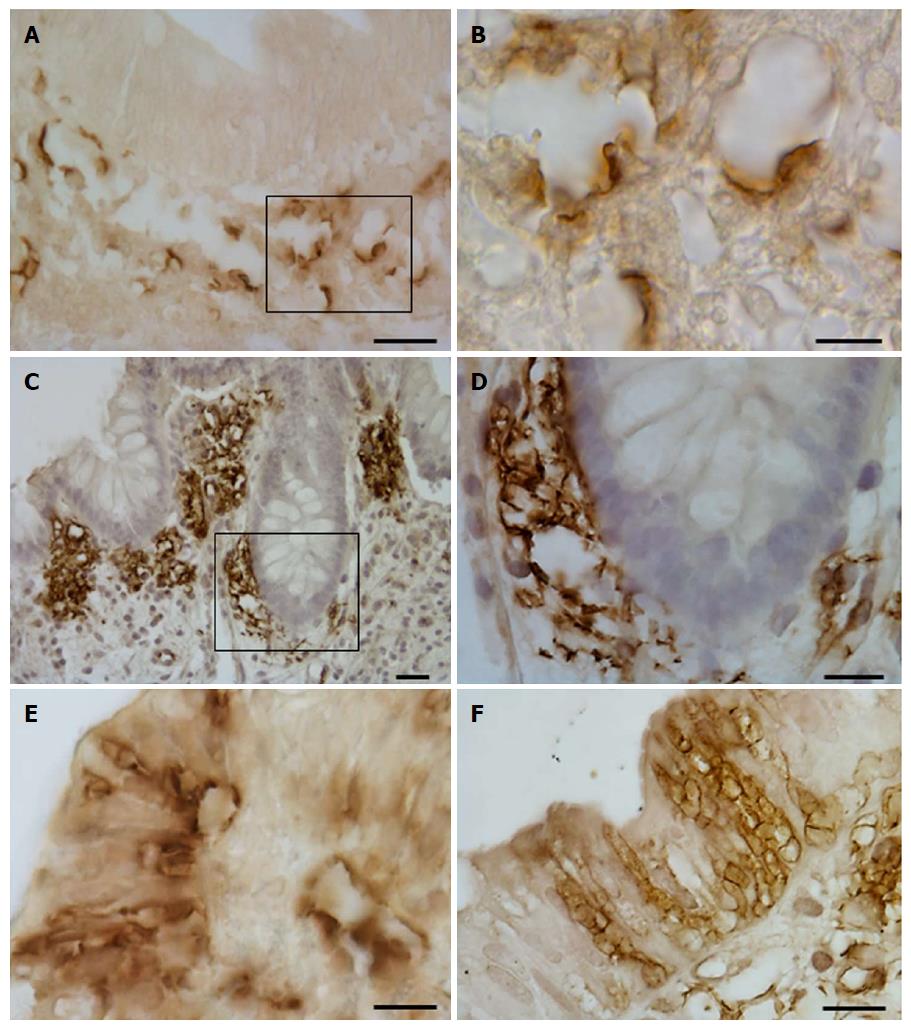
Figure 5 GLUT5 immunoreactivity is shown in vessel clusters localized beneath the epithelium (A and B) or around the glands (C and D), and in vacuolar structures in the epithelium (E and F).
The boxed area in (A and C) is shown at higher magnification in (B, D, respectively). Scale bar: (A, C, E and F) 25 μm; (D) 10 μm; (B) 5 μm.
- Citation: Merigo F, Brandolese A, Facchin S, Missaggia S, Bernardi P, Boschi F, D’Incà R, Savarino EV, Sbarbati A, Sturniolo GC. Glucose transporter expression in the human colon. World J Gastroenterol 2018; 24(7): 775-793
- URL: https://www.wjgnet.com/1007-9327/full/v24/i7/775.htm
- DOI: https://dx.doi.org/10.3748/wjg.v24.i7.775


