
















©The Author(s) 2018.
World J Gastroenterol. Feb 21, 2018; 24(7): 775-793
Published online Feb 21, 2018. doi: 10.3748/wjg.v24.i7.775
Published online Feb 21, 2018. doi: 10.3748/wjg.v24.i7.775
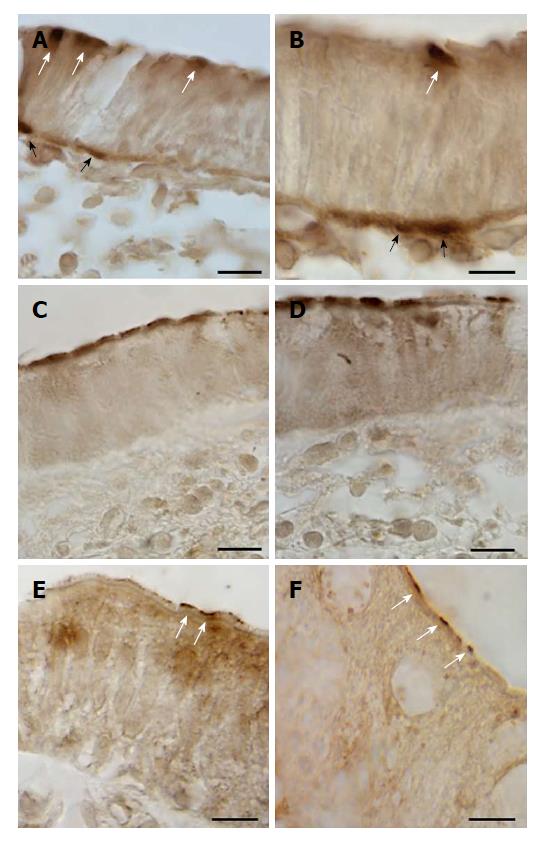
Figure 1 Immunoperoxidase staining showing GLUT2 (A-D) and SGLT1 (E and F) immunoreactivity in epithelial cells of the cecum (A and B), descending (C and D), and sigmoid (E and F) colon of human intestine.
White arrows indicate staining on the apical pole, black arrows on the basolateral membrane of epithelial intestinal cells. Scale bar: (A, C, D) 50 μm; (B, E, F) 5 μm.
- Citation: Merigo F, Brandolese A, Facchin S, Missaggia S, Bernardi P, Boschi F, D’Incà R, Savarino EV, Sbarbati A, Sturniolo GC. Glucose transporter expression in the human colon. World J Gastroenterol 2018; 24(7): 775-793
- URL: https://www.wjgnet.com/1007-9327/full/v24/i7/775.htm
- DOI: https://dx.doi.org/10.3748/wjg.v24.i7.775